- Home
- /
- SAS Viya
- /
- Visual Analytics
- /
- Re: VA Geographic Maps Dissappeared
- RSS Feed
- Mark Topic as New
- Mark Topic as Read
- Float this Topic for Current User
- Bookmark
- Subscribe
- Mute
- Printer Friendly Page

- Mark as New
- Bookmark
- Subscribe
- Mute
- RSS Feed
- Permalink
- Report Inappropriate Content
We've been using VA at my company for the past 8 months and installed VA 6.4 about a a month ago. Today, it seems that the geographic maps are missing.
Here is a snapshot of a report that we use regularly:
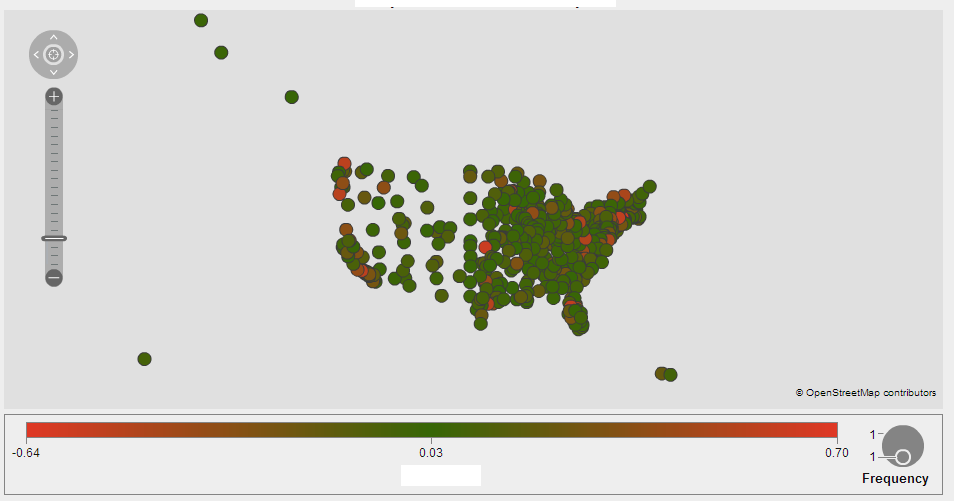
The map backgrounds are simply missing. it is the same for all three map types in VA (geo region/coordinate/bubble).
I've tried testing this on both new and existing reports and explorations. Also on different PCs.
Has anyone experienced this? Is there a simple fix?
Thanks,

- Mark as New
- Bookmark
- Subscribe
- Mute
- RSS Feed
- Permalink
- Report Inappropriate Content
That's the first I've seen this issue. It seems like there might be a problem with the configuration referencing the GIS server, OpenStreetMap or ESRI. I would recommend you open a support track so they can help you identify the root cause of this issue.
Rick
- Mark as New
- Bookmark
- Subscribe
- Mute
- RSS Feed
- Permalink
- Report Inappropriate Content
Thanks, will do.

- Mark as New
- Bookmark
- Subscribe
- Mute
- RSS Feed
- Permalink
- Report Inappropriate Content
Hi, we are having same issue with our maps. We are configuring maps for Visual Analytics 7.1
Did you manage to solve your problem?

- Mark as New
- Bookmark
- Subscribe
- Mute
- RSS Feed
- Permalink
- Report Inappropriate Content
Hey Folks,
have you seen the Installation Note 52133, i had the described issue with an upgrade, too.
But the problem in my case were not the additional parameters for the setenv.sh, they were set correctly.
The problem at my site was the proxy server for accessing the Open Street Map Servers at sas.
Maybe it helps.
Best regards,
Andreas
- Mark as New
- Bookmark
- Subscribe
- Mute
- RSS Feed
- Permalink
- Report Inappropriate Content
Thanks! We did have a look at the Installation Note and we did some of the changes suggested but the problem has not been fixed. We did open a support track with SAS.
Sonnia
.jpg")
Catch up on SAS Innovate 2026
Nearly 200 sessions are now available on demand with the SAS Innovate Digital Pass.
Explore Now →See how to use one filter for multiple data sources by mapping your data from SAS’ Alexandria McCall.

Find more tutorials on the SAS Users YouTube channel.
-
5 replies
-
06-10-2014 05:13 PM
-
3804 views
-
0 likes
-
4 in conversation
-
