- Home
- /
- Programming
- /
- Graphics
- /
- Re: gplot problem: values don't connect
- RSS Feed
- Mark Topic as New
- Mark Topic as Read
- Float this Topic for Current User
- Bookmark
- Subscribe
- Mute
- Printer Friendly Page

- Mark as New
- Bookmark
- Subscribe
- Mute
- RSS Feed
- Permalink
- Report Inappropriate Content
Dear all,
My values don't connect in a gplot although I write symbol statements. Does anybody know why this might happen? Here is my code (it shoul produce one line):
symbol1 interpol = join pointlabel height=0.75 line=1 color=CX113388 value=cube;
legend1 label=none position=(bottom center outside);
proc gplot data=mydata;
format num_var1 commax10.2;
plot num_var1 * char_var1 = num_var2 / autovref lautovref = 2 cautovref = CXEEEEEE
vzero
vaxis = axis1 haxis = axis2 vreverse
legend = legend1;
axis1 label=("My label" angle=90) minor=none order=(1 to 5 by 1) offset=(1cm);
axis2 label=none;
run;
quit;
num_var1 and num_var2 are numeric
char_var1 is character
Everything is done from the symbol statement except the interpol=join.
(I removed the labels, legend and values on the screenshot as it is company data)
Best wishes
Eva

- Mark as New
- Bookmark
- Subscribe
- Mute
- RSS Feed
- Permalink
- Report Inappropriate Content
Hi,
One way to control your SAS plots is in 'goption'. For example using SAS example ( it produce a graph like yours):
/* Put this line above your Graph, I put it here. This line is not in SAS example*/
goptions reset=global device=activex ypixels=600 xpixels=800;
data jobs;
length eng $5;
input eng dollars num;
datalines;
Civil 27308 73273
Aero 29844 70192
Elec 22920 89382
Mech 32816 19601
Chem 28116 25541
Petro 18444 34833
;
title1 "Member Profile";
title2 "Salaries and Number of Member Engineers";
axis1 label=none
offset=(5,5);
axis2 order=(0 to 40000 by 10000)
label=none;
proc gplot data=jobs;
format dollars dollar9. num comma7.0;
bubble dollars*eng=num / haxis=axis1
vaxis=axis2
vminor=1
bcolor=darkred
blabel
bsize=3;
run;
quit;
Then right click on the graph.Select "Graph Properties" and choose what you want. You can connect dots using regression, lines and ... .

- Mark as New
- Bookmark
- Subscribe
- Mute
- RSS Feed
- Permalink
- Report Inappropriate Content
Try leaving off the "= num_var2" in your plot statement.
- Mark as New
- Bookmark
- Subscribe
- Mute
- RSS Feed
- Permalink
- Report Inappropriate Content
@Mahommad: I want the value to be connected at start, not by manually selecting activex options.
@Robert: this works. But now I manipulate my data so that I have two distinct values of num_var2 in the data file. I'd like to have 2 lines then. So I have to include the "= num_var". Then the values aren't connected anymore 😞
- Mark as New
- Bookmark
- Subscribe
- Mute
- RSS Feed
- Permalink
- Report Inappropriate Content
Can you post some sample data (without real/proprietary values) that reproduces the problem?
- Mark as New
- Bookmark
- Subscribe
- Mute
- RSS Feed
- Permalink
- Report Inappropriate Content
Funny thing is that when I leave out "= num_var" I get two lines.
I have nearly the same plot with different data where my plot statement is
plot num_var1 * num_var2 = num_var3
i.e. are variables are numeric. This is the only difference. And here I get all lines for all the values of num_var3
Do you think the var type is the problem?
- Mark as New
- Bookmark
- Subscribe
- Mute
- RSS Feed
- Permalink
- Report Inappropriate Content
And are you using device=activex, or device=png? (this might make a difference)
- Mark as New
- Bookmark
- Subscribe
- Mute
- RSS Feed
- Permalink
- Report Inappropriate Content
I still use activex. Haven't found the time to switch to png.

- Mark as New
- Bookmark
- Subscribe
- Mute
- RSS Feed
- Permalink
- Report Inappropriate Content
Don't know if this issue is resolved. Here is SGPLOT solution:
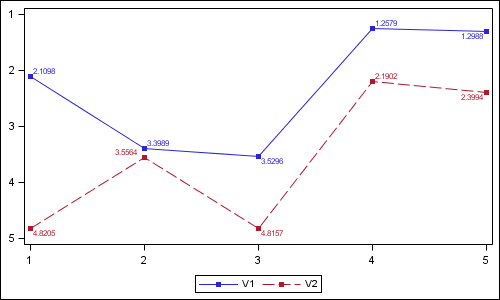
data values;
do x=1 to 5;
V1= 1+3*ranuni(2);
V2= 2+3*ranuni(2);
output;
end;
run;
ods graphics / reset width=5in height=3in imagename='Series';
proc sgplot data=values;
series x=x y=v1 / markers datalabel=v1 markerattrs=(symbol=squarefilled) ;
series x=x y=v2 / markers datalabel=v2 markerattrs=(symbol=squarefilled) ;
xaxis display=(nolabel);
yaxis display=(nolabel) reverse;
run;
- Mark as New
- Bookmark
- Subscribe
- Mute
- RSS Feed
- Permalink
- Report Inappropriate Content
Dear all,
in the meantime I found the reason for the problem. The reason is not activex. The problem was in my data. I had a fourth variable which had wrong values. After I fixed that, the plot was shown correctly!
Best wishes
Eva
.jpg")
Catch up on SAS Innovate 2026
Nearly 200 sessions are now available on demand in the Innovate Hub.
Watch Now →Learn how use the CAT functions in SAS to join values from multiple variables into a single value.

Find more tutorials on the SAS Users YouTube channel.
SAS Training: Just a Click Away
Ready to level-up your skills? Choose your own adventure.
-
9 replies
-
01-09-2013 04:01 AM
-
5669 views
-
0 likes
-
4 in conversation
-
