- Home
- /
- Analytics
- /
- Stat Procs
- /
- Extract smooting component values when using PROC SASGAMPL
- RSS Feed
- Mark Topic as New
- Mark Topic as Read
- Float this Topic for Current User
- Bookmark
- Subscribe
- Mute
- Printer Friendly Page
- Mark as New
- Bookmark
- Subscribe
- Mute
- RSS Feed
- Permalink
- Report Inappropriate Content
Hi,
I am running a GAM using SAS GAMPL to analyse herring landing data, with a spline term on year and month set as a tensor product, as specified in the following code:
ods graphics on;
proc gampl data=sales06 seed=1234 plots;
class ref_year;
output out=sales07y p=pred_hat lower=pred_p05 upper=pred_p95 residual=pred_res;
ods output ParameterEstimates=gamparms01y FitStatistics=gamfit01y NObs=gamobs01y;
model landing_her=spline(ref_year_ ref_month_/maxdf=100) / dist=Tweedie link=log;
RUN;
ods graphics off;
quit;
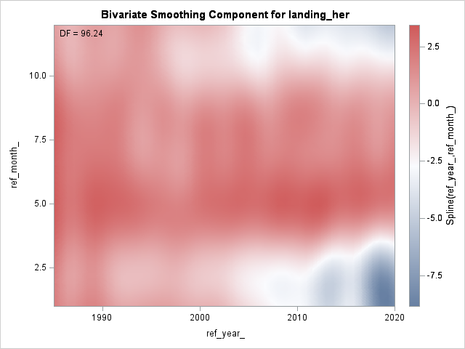
I would like to get the smoothing component values for each knot (i.e., combinations of year and month), or at least for the discrete pixels of the bivariate plot that SAS outputs (see below)

Could anyone help me on that?
Cheers
Paul
Accepted Solutions
- Mark as New
- Bookmark
- Subscribe
- Mute
- RSS Feed
- Permalink
- Report Inappropriate Content
You can get the smoothing component in the output data set by asking for the linear predictor and by using the COMPONENT option. For example:
proc gampl data=sales06 seed=1234 plots;
model landing_her=spline(ref_year_ ref_month_/maxdf=100) / dist=Tweedie link=log;
output out=SmoothComp linp=LinP/ COMPONENT;
RUN;
If you want the (x,y) values, you have to merge the original data and the output data set :
data All;
merge sales06 SmoothComp;
run;

/* OPTIONAL: visualize the smoothing component */
proc template;
   define statgraph surface;
      begingraph / designwidth=defaultDesignHeight;
         layout overlay;
            contourplotparm z=LinP_ref_year_ref_month_ y=ref_month_ x=ref_year_ / gridded=FALSE;
         endlayout;
      endgraph;
   end;
run;

proc sgrender data=ALL template=surface;
run;- Mark as New
- Bookmark
- Subscribe
- Mute
- RSS Feed
- Permalink
- Report Inappropriate Content
- Mark as New
- Bookmark
- Subscribe
- Mute
- RSS Feed
- Permalink
- Report Inappropriate Content
Thanks Ksharp for the quick feedback. Do you mean I should now contact @Rick_SAS, or is this implicit? Sorry if the question is a bit naive, but I have only recently started posting on the SAS communities forum.
Cheers,
Paul
- Mark as New
- Bookmark
- Subscribe
- Mute
- RSS Feed
- Permalink
- Report Inappropriate Content
When anyone "at-mentions" a user, they are automatically notified. So in this case, I got an email when KSharp mentioned me. Of course, the person mentioned might not have the time or interest to respond, but they are notified.
- Mark as New
- Bookmark
- Subscribe
- Mute
- RSS Feed
- Permalink
- Report Inappropriate Content
You can get the smoothing component in the output data set by asking for the linear predictor and by using the COMPONENT option. For example:
proc gampl data=sales06 seed=1234 plots;
model landing_her=spline(ref_year_ ref_month_/maxdf=100) / dist=Tweedie link=log;
output out=SmoothComp linp=LinP/ COMPONENT;
RUN;
If you want the (x,y) values, you have to merge the original data and the output data set :
data All;
merge sales06 SmoothComp;
run;

/* OPTIONAL: visualize the smoothing component */
proc template;
   define statgraph surface;
      begingraph / designwidth=defaultDesignHeight;
         layout overlay;
            contourplotparm z=LinP_ref_year_ref_month_ y=ref_month_ x=ref_year_ / gridded=FALSE;
         endlayout;
      endgraph;
   end;
run;

proc sgrender data=ALL template=surface;
run;ANOVA, or Analysis Of Variance, is used to compare the averages or means of two or more populations to better understand how they differ. Watch this tutorial for more.
Find more tutorials on the SAS Users YouTube channel.


