- Home
- /
- SAS Viya
- /
- Visual Analytics
- /
- SAS Visual Analytics Edit - Calculated Data with Condition
- RSS Feed
- Mark Topic as New
- Mark Topic as Read
- Float this Topic for Current User
- Bookmark
- Subscribe
- Mute
- Printer Friendly Page
- Mark as New
- Bookmark
- Subscribe
- Mute
- RSS Feed
- Permalink
- Report Inappropriate Content
Hi,
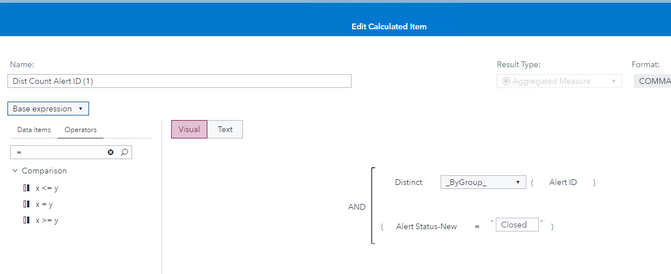
Is it possible to create a calculated data for example, a sum of distinct Alert ID but with a condition that Alert Status is 'Closed' only? I need this as a calculated data and not under Filter because filtering cannot combine two conditions of data to create a sum. Thank you.
Accepted Solutions
- Mark as New
- Bookmark
- Subscribe
- Mute
- RSS Feed
- Permalink
- Report Inappropriate Content
You can put conditions such as IF / ELSE in a calculated item.
You might use something like,
IF 'Alert Status'n = "Closed"
RETURN Distinct(_ByGroup_, 'Alert ID')
ELSE .
- Mark as New
- Bookmark
- Subscribe
- Mute
- RSS Feed
- Permalink
- Report Inappropriate Content
You can put conditions such as IF / ELSE in a calculated item.
You might use something like,
IF 'Alert Status'n = "Closed"
RETURN Distinct(_ByGroup_, 'Alert ID')
ELSE .
- Mark as New
- Bookmark
- Subscribe
- Mute
- RSS Feed
- Permalink
- Report Inappropriate Content
Thank you @Sam_SAS . But is it possible to add at least two calculated/aggregated measures? For example, I already created an aggregated measure for Andorra and Australia and I like to add them together. I know it sounds silly for an example. But this is the simplest example to explain what I am trying to do for a complex filter.
When I tried adding them together, the content is "missing" value. Is there a way to put together the sum of two filtered values?
For what I am actually doing right now, I need to add together the one NOT CAPTURED BY SVI Open Alerts filter (LAST_DISPOSITION_TIMESTAMP= Missing and ALERT_STATUS = "Closed" and "Suppressed") and SVI Handled Alerts filter (LAST_DISPOSITION_TIMESTAMP= NotMissing and ALERT_STATUS = "Active", "Closed" and "Suppressed"). So in essence 34 + 1,455 =1,489. See table below for reference (rows highlighted in yellow). I need to show 1,489 value:
Thank you.
- Mark as New
- Bookmark
- Subscribe
- Mute
- RSS Feed
- Permalink
- Report Inappropriate Content
- Mark as New
- Bookmark
- Subscribe
- Mute
- RSS Feed
- Permalink
- Report Inappropriate Content
But for the case of the earlier example I did for Andorra and Australia, there should be number when you add those two values right? How come it's "(missing)"?
- Mark as New
- Bookmark
- Subscribe
- Mute
- RSS Feed
- Permalink
- Report Inappropriate Content
Calculated items are evaluated for every row in the query, so I think a nonmissing value would only be returned if Australia AND Andorra match your conditions.
That said, I did an experiment returning 0 for calculated items and I got an unexpected result:
The first table and key value use calculated items that return Missing. The second pair of object use items that return zero. The table results look good, but the key value unexpectedly returns 0.
I think that Key Value cannot aggregate the distinct value aggregated measures, because that is effectively a nested aggregation? I think we probably should not allow an aggregated measure to be assigned to Key Value, but I'll check that with the dev team.
One workaround to this to would be precalculate your conditioned distinct values as part of your data prep. If they are precalculated, they will be regular measures and should display just fine in Key Value. On the down side, they will not be responsive to data filters, etc.
Sam
- Mark as New
- Bookmark
- Subscribe
- Mute
- RSS Feed
- Permalink
- Report Inappropriate Content
Actually, Key Value works fine for a basic Distinct calculation. So I am not totally sure what's up here. For the key value in your report, you could just display the distinct count of Open Alerts and filter that object to include only Andorra + Australia. This should yield the right number.
Then use your calculated item that returns 0 to get the right values in your table.
- Mark as New
- Bookmark
- Subscribe
- Mute
- RSS Feed
- Permalink
- Report Inappropriate Content
I see. Thank you very much for your explanation @Sam_SAS
See how to use one filter for multiple data sources by mapping your data from SAS’ Alexandria McCall.
Find more tutorials on the SAS Users YouTube channel.


