- Home
- /
- SAS Viya
- /
- Visual Analytics
- /
- How to maintain the same chart structure when filtering?
- RSS Feed
- Mark Topic as New
- Mark Topic as Read
- Float this Topic for Current User
- Bookmark
- Subscribe
- Mute
- Printer Friendly Page

- Mark as New
- Bookmark
- Subscribe
- Mute
- RSS Feed
- Permalink
- Report Inappropriate Content
Hi!
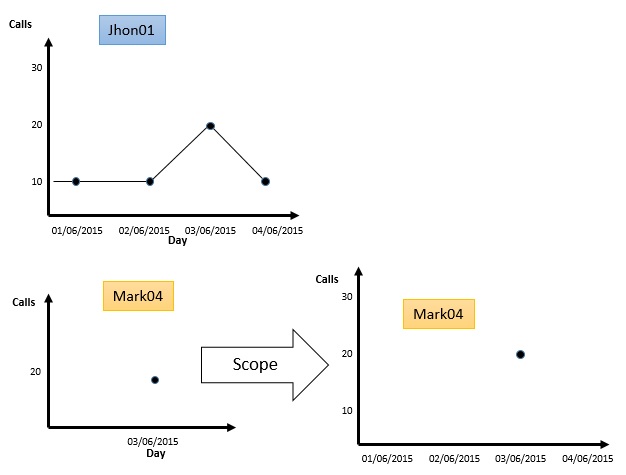
I would like to know how it's possible to maintain on the x and y axis all the range measures (in this case: days and calls) and the same chart structure.
When I use either the whole data-set aggregated or an ID which makes calls every day there is no problem.
Instead when there aren't any value recorded within some days SAS VA keeps on the 2 axes, just the value recorded for that ID.
For instance I have the following data-set
ID | DAY | NUMBER OF CONTACTS |
Jhon01 | 01/06/2015 | 10 |
Jhon01 | 02/06/2015 | 10 |
Jhon01 | 03/06/2015 | 20 |
Jhon01 | 04/06/2015 | 10 |
Mark04 | 03/06/2015 | 20 |
The aim is to have the exact graph structure of Jhon01 when instead I'm focusing on Mark04.
Thanks in advance for your help.


- Mark as New
- Bookmark
- Subscribe
- Mute
- RSS Feed
- Permalink
- Report Inappropriate Content
Hello,
In the data explorer, there is "lock axis" feature that would be helpful here.
I'm not sure if the same feature is available in the report designer, but you can manually set the min and max values for the axes if that would be helpful.
Thanks,
Sam
- Mark as New
- Bookmark
- Subscribe
- Mute
- RSS Feed
- Permalink
- Report Inappropriate Content
Hi Sam,
thank for your support
I tried as you specified but I’m encountering the same issue since I can't fix the x axis.
I need to maintain on the axis of abscissae (x) al the days of the week even if a consumer is calling just on Monday.
I should have trace of his numeric weather he's calling or not.
The problem that on my dataset I just have the records of the days when he’s calling.
Thanks again!
- Mark as New
- Bookmark
- Subscribe
- Mute
- RSS Feed
- Permalink
- Report Inappropriate Content
Hi again,
I see your problem, you cannot lock the X axis for a line plot.
If you go into the report designer and create a time series plot, then you can manually specify the min and max values for the X axis. That might help, although you do have to hardcode the min/max values.
- Mark as New
- Bookmark
- Subscribe
- Mute
- RSS Feed
- Permalink
- Report Inappropriate Content
It works.
Thanks a lot!

- Mark as New
- Bookmark
- Subscribe
- Mute
- RSS Feed
- Permalink
- Report Inappropriate Content
So glad you found your solution, leonardoacn!
Please mark the "correct" answer so other community members will know what worked.
Thanks!
Anna
.jpg")
Catch up on SAS Innovate 2026
Nearly 200 sessions are now available on demand with the SAS Innovate Digital Pass.
Explore Now →See how to use one filter for multiple data sources by mapping your data from SAS’ Alexandria McCall.

Find more tutorials on the SAS Users YouTube channel.
-
5 replies
-
05-30-2015 09:42 AM
-
3150 views
-
2 likes
-
3 in conversation
-
