- Home
- /
- SAS Viya
- /
- Visual Analytics
- /
- Re: Graph for Market Basket Analysis
- RSS Feed
- Mark Topic as New
- Mark Topic as Read
- Float this Topic for Current User
- Bookmark
- Subscribe
- Mute
- Printer Friendly Page

- Mark as New
- Bookmark
- Subscribe
- Mute
- RSS Feed
- Permalink
- Report Inappropriate Content
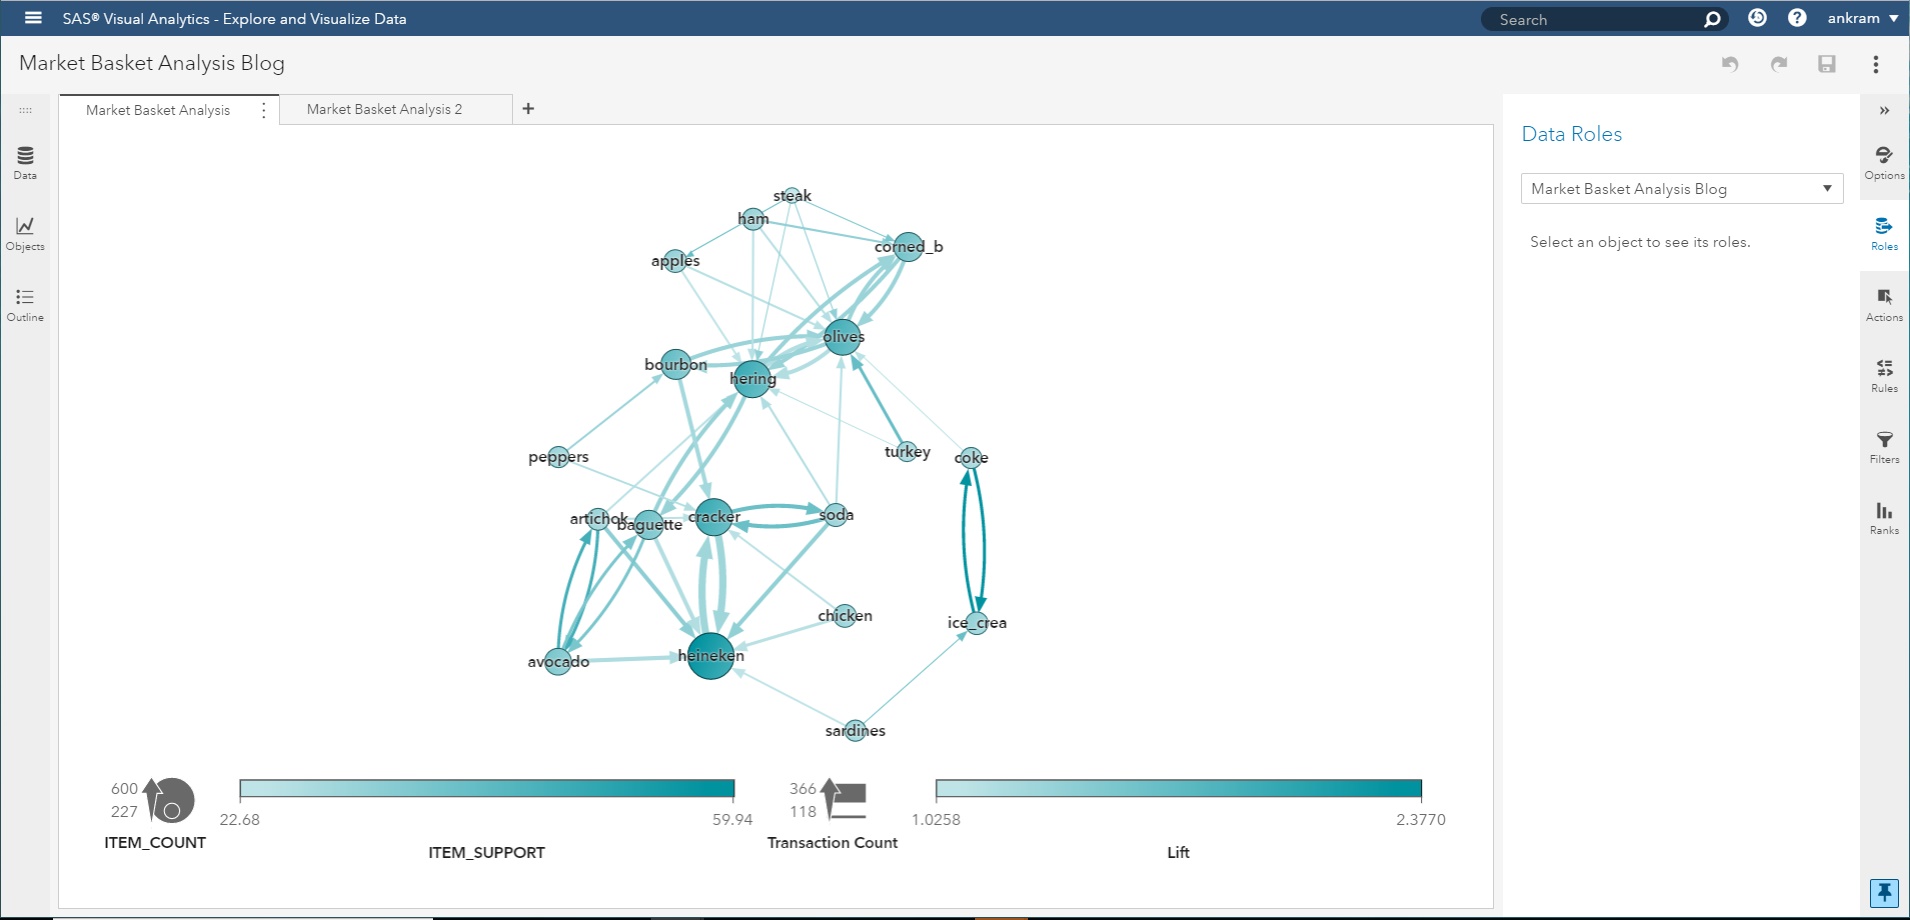
What's the name for the type of graph below? I saw similar graph create for market basket analysis in multiple analytical tools but I don't know what's the official name. Also, is it possible to graph something similar with SAS EG?
Accepted Solutions

- Mark as New
- Bookmark
- Subscribe
- Mute
- RSS Feed
- Permalink
- Report Inappropriate Content
Hi @Fae
If I'm not mistaken, this is a Network Diagram. Here is an SAS Global Forum (SGF) paper showing examples of such diagram
For programming in EG, you can try the following link
Hope this helps,
Ahmed
- Mark as New
- Bookmark
- Subscribe
- Mute
- RSS Feed
- Permalink
- Report Inappropriate Content

- Mark as New
- Bookmark
- Subscribe
- Mute
- RSS Feed
- Permalink
- Report Inappropriate Content
do you think is possible to replicate the example written in the papaer also in Visual Analytics 7.3?
Thank you
.jpg")
Catch up on SAS Innovate 2026
Nearly 200 sessions are now available on demand in the Innovate Hub.
Watch Now →See how to use one filter for multiple data sources by mapping your data from SAS’ Alexandria McCall.

Find more tutorials on the SAS Users YouTube channel.
-
3 replies
-
05-22-2018 01:21 PM
-
3569 views
-
0 likes
-
3 in conversation
-
