- Home
- /
- SAS Viya
- /
- Visual Analytics
- /
- Calculation issue (nested aggregation?)
- RSS Feed
- Mark Topic as New
- Mark Topic as Read
- Float this Topic for Current User
- Bookmark
- Subscribe
- Mute
- Printer Friendly Page
- Mark as New
- Bookmark
- Subscribe
- Mute
- RSS Feed
- Permalink
- Report Inappropriate Content
Hi everyone,
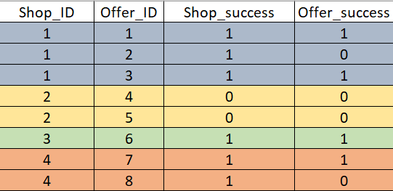
I struggle to create a new calculated item based on the variables shown in the table below. Let's say we have many shops (each matched by single shop_id), offering specific offers (offer_id). These offers are flagged as "1", if they are successful. If at least one of the offers of a shop is successful, then the shop_success variable is flagged as "1" for every row matching the specific shop.
Now, I would like to get the sum of distinct values of shop_success for each shop_id. So for this example I would want my calculated item to equal 3 (1 <for shop_id = 1> + 0 <for shop_id = 2> + 1 <for shop_id = 3> + 1 <for shop_id = 4>).
What I feel could work is: sum _for all_ (distinct _by group_ (shop_success)), however nested aggregations are not supported, so I suppose that's the challenge I am facing here.
I know how to do it with code, but I would like to use the provided table having only these variables.
Thanks for any help 🙂
Accepted Solutions
- Mark as New
- Bookmark
- Subscribe
- Mute
- RSS Feed
- Permalink
- Report Inappropriate Content
Hi @piecze,
The question is a little bit complicated, but I have taken a stab at it.
If I understand correctly, you just want to calculate the number of Shop_IDs where Shop_success is 1. The calculated item will yield the same value for every row in the table.
If that is correct, here is one approach (as a table and as a crosstab):
The expression I am using is:
AggregateTable(_Sum_, Table(_Max_, Fixed('Shop_ID'n), 'Shop_success'n))
The AggregateTable operator is available only in Viya versions of VA.
We don't actually need to worry about distict count because the values are all either 1 or 0. So we can use Max as the inner aggregation.
There may be other solutions to the same problem within VA. If you have an older version of VA, it might be best to calculate this value as part of your data preparation.
Let me know if that helps or if I have misunderstood something.
Thanks,
Sam
- Mark as New
- Bookmark
- Subscribe
- Mute
- RSS Feed
- Permalink
- Report Inappropriate Content
It worked! Thank you so much @Sam_SAS!
I actually wanted to use the calculated item in other objects and it works fine as well 🙂
Small update for anyone having a similar issue - the solution provided by Sam (AggregateTable) requires the "shop_id" column used inside _Fixed_() function to be a character category. In my case it was set as numeric, but all you have to do is change it using the Format operator.
Thanks again Sam!
- Mark as New
- Bookmark
- Subscribe
- Mute
- RSS Feed
- Permalink
- Report Inappropriate Content
Great! Glad to hear it worked for you.
I encountered the data type issue myself. It is one of the many quirky things about working with calculated expressions in VA. The TreatAs() operator is used to convert in the other direction and between numerics and dates.
Sam
See how to use one filter for multiple data sources by mapping your data from SAS’ Alexandria McCall.
Find more tutorials on the SAS Users YouTube channel.


