- Home
- /
- SAS Viya
- /
- Visual Analytics
- /
- Bubble Plot Animation
- RSS Feed
- Mark Topic as New
- Mark Topic as Read
- Float this Topic for Current User
- Bookmark
- Subscribe
- Mute
- Printer Friendly Page

- Mark as New
- Bookmark
- Subscribe
- Mute
- RSS Feed
- Permalink
- Report Inappropriate Content
My VA is 6.2. When I use Bubble Plot, I cannot find Animation in Role
Anything wrong with VA version or setting?

- Mark as New
- Bookmark
- Subscribe
- Mute
- RSS Feed
- Permalink
- Report Inappropriate Content
Hi There,
In SAS Visual Analytics the Animation role is enabled only if you assign a data item to the Group role.
This is documented at SAS(R) Visual Analytics 6.2: User's Guide - Bubble Plot
Kind Regards,
Michelle
- Mark as New
- Bookmark
- Subscribe
- Mute
- RSS Feed
- Permalink
- Report Inappropriate Content
I have read the Guide and assiagn a item to the Group role.However, I stiil cannot find the Animation role.
- Mark as New
- Bookmark
- Subscribe
- Mute
- RSS Feed
- Permalink
- Report Inappropriate Content
Do you have a datetime data item in your table? Perhaps include a screenshot of your data items and Roles tab so that we can see what you are experiencing.
Kind Regards,
Michelle
- Mark as New
- Bookmark
- Subscribe
- Mute
- RSS Feed
- Permalink
- Report Inappropriate Content
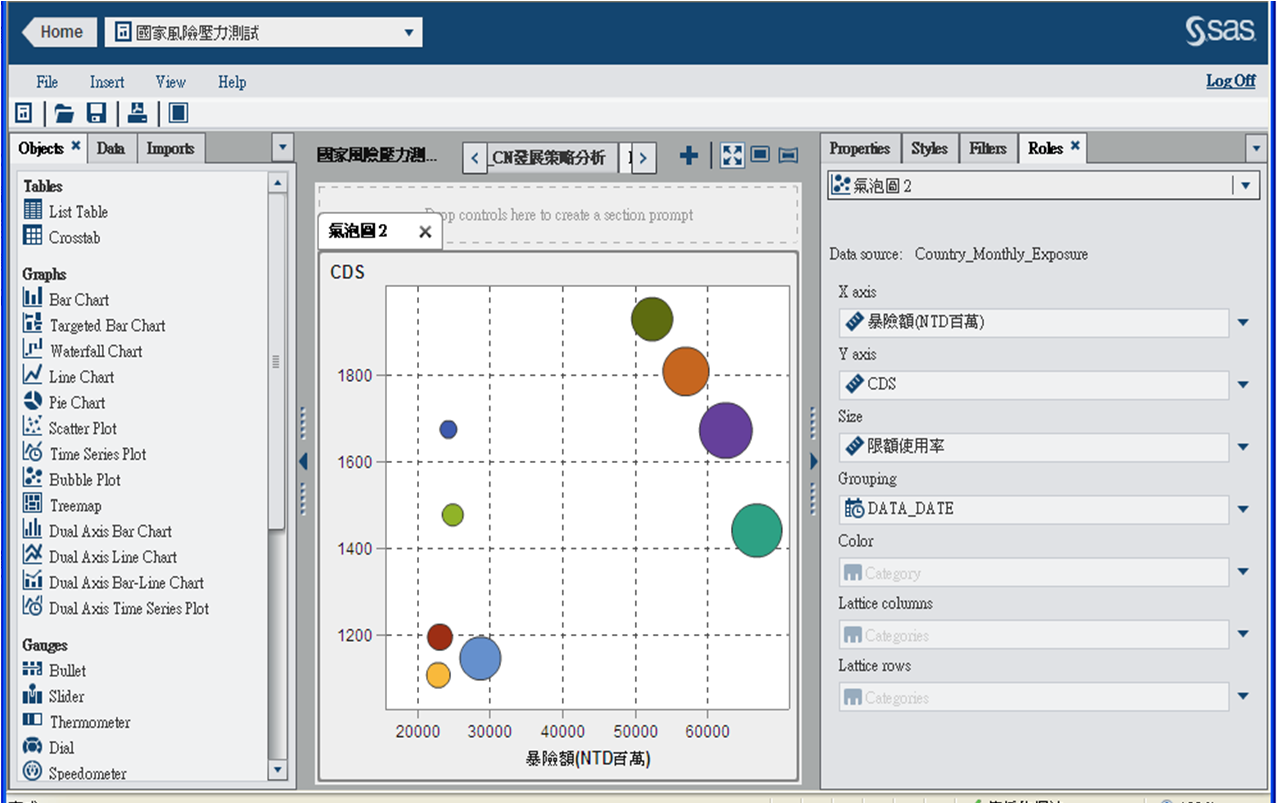
This is my VA..I cannot find Animation in Role
IUser's Guide of VA 6.1& 6.2 have introduced animation function. I think the animation function is ready since VA 6.1
- Mark as New
- Bookmark
- Subscribe
- Mute
- RSS Feed
- Permalink
- Report Inappropriate Content
As pointed out below the animation role was only introduced in Visual Analytics Designer from VA6.3 and as you are using VA6.2 it is not available as you can see. If you have a look in the SAS Visual Analytics 6.3: What's New document you will see in the section titled Enhanced Report Objects there is a bullet point that states "Bubble plots, geo bubble maps, and bar charts (with no groups, rows, or columns) with a date data item can be animated."
The Visual Analytics 6.2 Users Guide does include documentation on the animation role but this is for the Visual Analytics Explorer visualization (as provided above) and not the Visual Analytics Designer bubble plot report object which you are using as per your screenshot (thanks for providing). Within the documentation for the VA6.2 bubble plot report object does not mention animation - SAS(R) Visual Analytics 6.2: User's Guide - Bubble plot report object
If you require animated bubble plots for your reports, you may need to consider upgrading your VA environment.
Kind Regards,
Michelle

- Mark as New
- Bookmark
- Subscribe
- Mute
- RSS Feed
- Permalink
- Report Inappropriate Content
SullivanC,
If you are in the designer or report builder its not there until VA 6.3. Though its there in the explorer.
Regards,
Justin
.jpg")
Catch up on SAS Innovate 2026
Nearly 200 sessions are now available on demand in the Innovate Hub.
Watch Now →See how to use one filter for multiple data sources by mapping your data from SAS’ Alexandria McCall.

Find more tutorials on the SAS Users YouTube channel.
-
6 replies
-
06-05-2014 06:54 AM
-
4869 views
-
6 likes
-
3 in conversation
-
