Hey Allan,
normally we use a simple boxplot to calculate the median and other numbers.
I don`t really have a solution to calculate the median on the fly within a crosstab, like avg,min, max etc.
But maybe this will be an acceptable workaround for you?
1. Build a Data Query with simple proc sql
........
.......
proc sql noprint;
create view TEMP_LASR_VIEW_0 as
SELECT
CARS5.Type length=6 format=$6. AS Type,
median(CARS5.Horsepower) length=8 format=BEST12. AS Horsepower
FROM
LASRLIB.CARS5 CARS5
GROUP BY
Type ;
.......
......
(Or use proc means with output out=...)
2. Use the table in your report
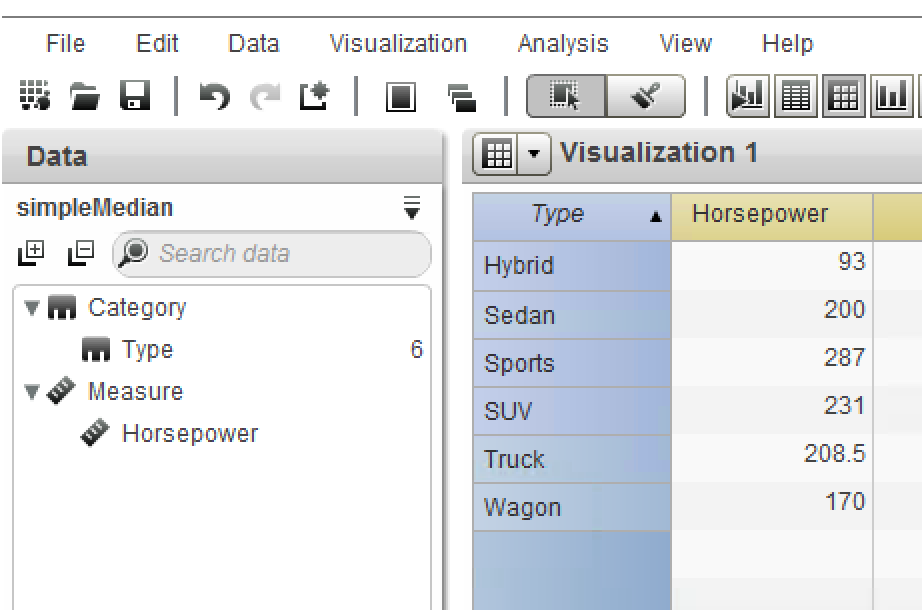
Performance will maybe be a problem.
You have to type median into the expression field, because in the default functionlist there isn`t median.
kind regards
Marius


.jpg")

