- RSS Feed
- Mark Topic as New
- Mark Topic as Read
- Float this Topic for Current User
- Bookmark
- Subscribe
- Mute
- Printer Friendly Page

- Mark as New
- Bookmark
- Subscribe
- Mute
- RSS Feed
- Permalink
- Report Inappropriate Content
Suppose X = 1,2,3,4,5,6,7 and P(X=x)=0.009, 0.001, 0.036, 0.027, 0.145 0.309, 0.473 resulting in E(X)=6.117. We can simulate from this distribution using
%let p=0.009 0.001 0.036 0.027 0.145 0.309 0.473;
%let seed=123456;
%let samplesize=1000;
%let delta=0.7; *mean difference;
data sample(keep= id x group);
call streaminit(&seed);
array p[6] (0.009 0.001 0.036 0.027 0.145 0.309); *p of the last category (7) is left out ;
do ID = 1 to &samplesize;
x = rand("Table", of p
group=1;
output;
end;
run;
OR
proc iml;
x = 1:7;
ExpVal=sum(x#{&p});
call randseed(&seed);
group1 = sample(x, &samplesize, "Replace", {&p});
quit;
My questions are the following;
(1) How can I modify P(X=x) such that E(X) is e.g., 5.5 (from 6.117) for group 1, assuming equal variances? So a shift of E(X) downwards.
(2) If I have a second group (group=2), how can I adapt the above code to result in a mean difference (delta=0.3 or 0.7) with group 2 always being higher, considering boundary limitations towards the last category (X=7)? A shift of E(X) upwards.
Accepted Solutions

- Mark as New
- Bookmark
- Subscribe
- Mute
- RSS Feed
- Permalink
- Report Inappropriate Content
HoHo. You seems to do some linear program . You should post it at OR forum , and I think there should be lots of solution .
The following is the solution from IML.
proc iml;
p={0.009 0.001  0.036  0.027  0.145  0.309  0.473};
x=1:7;
mean=(p#x)[+];
var=(p#((x-mean)##2))[+];
print mean var;

v=(x-5.5)##2; /*calculated var coefficient*/
print v[f=best8.];


/*Start Solution*/
object = { 1 1 1 1 1 1 1 };
coef = {1 2 3 4 5 6 7, /*mean */
  20.25  12.25  6.25  2.25   0.25   0.25 2.25 , /* var coefficient e.g row vector V */
  1 1 1 1 1 1 1 /* sum of p is 1 */
};
b = { 5.5 ,1.277311,1 };
l = { 0.01 0.01 0.01 0.01 0.01 0.01 0.01};
u = { 0.9 0.9 0.9 0.9 0.9 0.9 0.9};
rowsense = {'E','E','E'};
cntl= -1;
call lpsolve (rc,objv,solution,dual,rd,object,coef,b,cntl,rowsense,,l,u);
print  solution ;
quit;
Xia Keshan

- Mark as New
- Bookmark
- Subscribe
- Mute
- RSS Feed
- Permalink
- Report Inappropriate Content
When you say "assuming equal variances" do you mean that the new probabilities give rise to a variance that is the same as for this example?
Define
p = {&p}`;
The variance is sum(x## # p) - ExpVal##2 = 1.277.;
The p vector is a 7-element vector with 6 free parameters (since sum(p)=1).
It looks like the problem is linear in the parameters p, so I would attempt to solve this as a linear programming problem.
The constraints are p[1]>0, ..., p[7]>0, sum(p)=1, mean=5.5, and Variance=1.277.
If you are using a recent version of SAS/IML, you can use the LPSOLVE call to solve LP problems. For older versions of IML, use the LP call.
I think there might be infinitely many solutions to your problem.
- Mark as New
- Bookmark
- Subscribe
- Mute
- RSS Feed
- Permalink
- Report Inappropriate Content
HoHo. You seems to do some linear program . You should post it at OR forum , and I think there should be lots of solution .
The following is the solution from IML.
proc iml;
p={0.009 0.001  0.036  0.027  0.145  0.309  0.473};
x=1:7;
mean=(p#x)[+];
var=(p#((x-mean)##2))[+];
print mean var;

v=(x-5.5)##2; /*calculated var coefficient*/
print v[f=best8.];


/*Start Solution*/
object = { 1 1 1 1 1 1 1 };
coef = {1 2 3 4 5 6 7, /*mean */
  20.25  12.25  6.25  2.25   0.25   0.25 2.25 , /* var coefficient e.g row vector V */
  1 1 1 1 1 1 1 /* sum of p is 1 */
};
b = { 5.5 ,1.277311,1 };
l = { 0.01 0.01 0.01 0.01 0.01 0.01 0.01};
u = { 0.9 0.9 0.9 0.9 0.9 0.9 0.9};
rowsense = {'E','E','E'};
cntl= -1;
call lpsolve (rc,objv,solution,dual,rd,object,coef,b,cntl,rowsense,,l,u);
print  solution ;
quit;
Xia Keshan
- Mark as New
- Bookmark
- Subscribe
- Mute
- RSS Feed
- Permalink
- Report Inappropriate Content
This seems to be a completely appropriate question for the IML forum.
- Mark as New
- Bookmark
- Subscribe
- Mute
- RSS Feed
- Permalink
- Report Inappropriate Content
Hope so . Rick . ![]()
- Mark as New
- Bookmark
- Subscribe
- Mute
- RSS Feed
- Permalink
- Report Inappropriate Content
Thanks Rick and Xia.
Rick, Indeed I meant that the new probabilities would give rise to the same variance.
Xia, the solution you provide is what I needed for part 1 of my question (which is to obtain E(X)=5.5). I modified your code to include the sampling for the two groups. Many thanks.
However, for part 2 of my question, if for example, E(X) should become 6.867 (which would be a shift upwards of 0.75), the lpsolve call returns 0's for the solution. I think this is because the desired E(X)=6.867 is too close to the maximum score (7) inducing boundary problems. Are there any alternatives to dealing with this?
%let seed=123456;
%let samplesize=1000000;
%let delta=0.75; * mean difference or shift ;
proc iml;
p={0.009 0.001 0.036 0.027 0.145 0.309 0.473};
x=1:7;
mean=(p#x)[+];
var=(p#((x-mean)##2))[+];
print mean var;
expectmean=mean + δ * mean shifted by delta ;
v=(x-expectmean)##2; /*calculated var coefficient*/
print expectmean, v[f=best8.];
/*Start Solution*/
object = { 1 1 1 1 1 1 1 };
coef=x//v//object;
print coef;
b = expectmean // var // {1};
l = { 0.00001 0.00001 0.00001 0.00001 0.00001 0.00001 0.00001};
u = { 0.9999 0.9999 0.9999 0.9999 0.9999 0.9999 0.9999};
rowsense = {'E','E','E'};
cntl= -1;
call lpsolve (rc,objv,solution,dual,rd,object,coef,b,cntl,rowsense,,l,u);
print solution ;
mean2=(solution`#x)[+];
var2=(solution`#((x-mean2)##2))[+];
print mean var mean2 var2;
/* Sampling for the two groups */
call randseed(&seed);
group1 = sample(x, &samplesize, "Replace", p);
group2 = sample(x, &samplesize, "Replace", solution);
print (mean(group1`))[label="Sample mean group 1"] (var(group1`))[label="Sample Variance Group 1"],
(mean(group2`))[label="Sample mean group 2"] (var(group2`))[label="Sample variance group 2"];
quit;
- Mark as New
- Bookmark
- Subscribe
- Mute
- RSS Feed
- Permalink
- Report Inappropriate Content
For you second question, I don't understand "considering boundary limitations towards the last category (X=7)" , you want only change P(x=7) and keep other the same ? But if others have been settled ,then P(x=7) is all settled .
If you only want change E(X) = E(X)+0.3 =6.417, that would be easy .
proc iml;
p={0.009 0.001 0.036 0.027 0.145 0.309 0.473};
x=1:7;
mean=(p#x)[+] ;
var=(p#((x-mean)##2))[+];
print mean var;
v=(x-6.417 /*Delta is 0.3*/)##2; /*calculated var coefficient*/
print v[f=best8.];
/*Start Solution*/
object = { 1 1 1 1 1 1 1 };
coef = {1 2 3 4 5 6 7}//v//{1 1 1 1 1 1 1};
b = { 6.417 /*Delta is 0.3*/}//var//{1};
l = { 0.01 0.01 0.01 0.01 0.01 0.01 0.01};
u = { 0.9 0.9 0.9 0.9 0.9 0.9 0.9};
rowsense = {'E','E','E'};
cntl= -1;
call lpsolve (rc,objv,solution,dual,rd,object,coef,b,cntl,rowsense,,l,u);
print solution ;
mean=(solution`#x)[+] ;
var=(solution`#((x-mean)##2))[+];
print mean var;
quit;
Xia Keshan
- Mark as New
- Bookmark
- Subscribe
- Mute
- RSS Feed
- Permalink
- Report Inappropriate Content
Hi Xia Keshan!
Indeed, everything works well when newExpectedValue=E(X) + delta as long as delta is less than or equal to 0.66 (leading to newExpectedValue=6.77). The second question is simply a need to shift E(X) from 6.11 to 6.86 (delta=0.75).
- Mark as New
- Bookmark
- Subscribe
- Mute
- RSS Feed
- Permalink
- Report Inappropriate Content
if E(X) should become 6.867, I am kind of get feeling LPSOLVE() can't do that , unless sum of p could greater than 1.
or you could post it at OR forum , and see if somebody have a better method .
- Mark as New
- Bookmark
- Subscribe
- Mute
- RSS Feed
- Permalink
- Report Inappropriate Content
Lots of thanks though!
- Mark as New
- Bookmark
- Subscribe
- Mute
- RSS Feed
- Permalink
- Report Inappropriate Content
Hi. If you allow a little offset , you could try this:
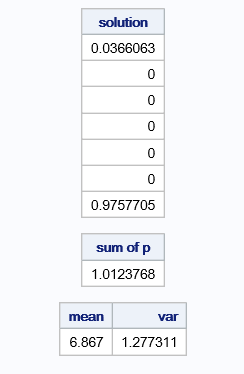
proc iml;
p={0.009 0.001  0.036  0.027  0.145  0.309  0.473};
x=1:7;
mean=(p#x)[+] ;
var=(p#((x-mean)##2))[+];
print mean var;


v=(x-6.867)##2; /*calculated var coefficient*/
print v[f=best8.];


/*Start Solution*/

object = { 0 0 0 0 0 0 0 };
coef = {1 2 3 4 5 6 7}//v//{1 1 1 1 1 1 1};
b = { 6.867}//var//{1};
l = {0 0 0 0 0 0 0 };
u = {1 1 1 1 1 1 1 };
rowsense = {'E','E','G'} ;
cntl= -1;
call lpsolve (rc,objv,solution,dual,rd,object,coef,b,cntl,rowsense,,l,u);
print  solution ,(solution[+])[label='sum of p'];
mean=(solution`#x)[+] ;
var=(solution`#((x-mean)##2))[+];
print mean var;
quit;
Xia Keshan
- Mark as New
- Bookmark
- Subscribe
- Mute
- RSS Feed
- Permalink
- Report Inappropriate Content
Hi Xia,
I would prefer not to have an offset. But am so thankful for your efforts.
.jpg")
Catch up on SAS Innovate 2026
Nearly 200 sessions are now available on demand with the SAS Innovate Digital Pass.
Explore Now →- Spring 2026 ESUG Meeting - Social Celebration | 02-Jun-2026
- Spring 2026 ESUG Meeting | 03-Jun-2026
- Ask the Expert: Fast, Clear, Beautiful: Your First Steps With PROC SGPLOT | 04-Jun-2026
- Ask the Expert: R and SAS Working Seamlessly Together: Unlocking PROC R in Viya for Life Sciences | 11-Jun-2026
- Ask the Expert: Can Agents Reduce Planning Friction in CPG Supply Chains? | 16-Jun-2026
- Ask the Expert: Get Meaningful Results With New Features in SAS Customer Intelligence 360 | 25-Jun-2026
-
11 replies
-
05-31-2015 12:47 AM
-
5098 views
-
3 likes
-
3 in conversation
-
