- Home
- /
- SAS Communities Library
- /
- Build a date in SAS Visual Analytics reports
- RSS Feed
- Mark as New
- Mark as Read
- Bookmark
- Subscribe
- Printer Friendly Page
- Report Inappropriate Content
Build a date in SAS Visual Analytics reports
- Article History
- RSS Feed
- Mark as New
- Mark as Read
- Bookmark
- Subscribe
- Printer Friendly Page
- Report Inappropriate Content
You may run into the requirement where you need to build out a date to use in either:
- objects,
- filtering,
- or display rules.
Below is a quick reference for how you can build a date to use in your SAS Visual Analytics reports and a few example requirements that have popped up lately.
I have recorded an accompanying video tutorial for these examples so that you may follow along.
Build a date for objects
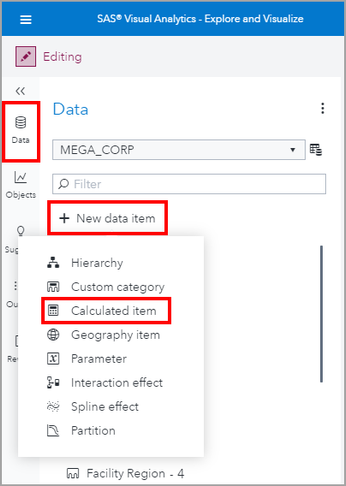
From the Data pane, use the New data item menu and select Calculated item.
Mobile users: To view the images, select the "Full" version at the bottom of the page.
Then, in the expression builder, expand the Date and Time grouping and add the DateFromMDY to the expression. Each parameter value is expected to be numeric representing month, day, year, hence the name MDY. For full details, see SAS Documentation under Reference: Operators for Data Expressions.
In this example below, DateFromMDY(1, 1, 2021), evaluates to January 1, 2021.
Here is this new calculated data item in a List Table object:
You can expand the data item properties and use the Format button to view all of the available formats.
Build a dynamic date for Filtering
Now let’s cover how to use this operator to build a dynamic date. Let’s imagine our requirement is to Filter an object to only show data for the current month and beyond. For this, we will need to build a date that represents the first day of the current month to use in the filter.
In pseudocode, we will need to create the syntax for: DateFromMDY( current month, 1, current year).
Here is what the expression looks like:
Let’s take a closer look at the current month expression. Remember that the expected parameter is to be numeric. The Month() operator returns a numeric 1-12 of a date parameter. The Now() operator returns a datetime value so we must wrap the DatePart() operator around it to extract only the date value. You can use the icon in front of the operators to help determine the operators’ result type.
Here are what some of the expression values look like when separated:
So when we want to use this dynamic calculation in a Filter, it would look something like this. We want to return the rows where the Day is greater than or equal to the first day of the current month.
Build a dynamic date for a Display Rule
You can also use dates in Display Rules. The date data item must be assigned a role in the object, so in my example I will be using a List Table object. Let’s say the requirement for this object is to dynamically highlight the rows for the current month only, but with an advanced twist.
If there were not advanced twist, we could do this by calculating two data items, if you don’t already have them in your data, for month. You could calculate the month of the row by Month(date) and current month as Month(Now()) and then use those data items in the Display Rule expression. If Month(date) = Month(Now()) then highlight the row.
However, to showcase the build a date example, let’s say that we want to highlight the rows of data from the previous month’s 15th to the current month’s 15th. So we will need to create two data items to represent the Previous Month (15th) and Current Month (15th).
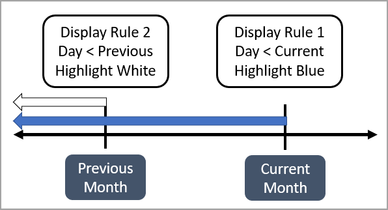
The Display Rules does not have a Between operator we can use so we will need to stack two display rules together. We will create one rule where we will highlight all of the days less than the Current Month (15th) in blue and then remove the highlighting, by highlighting the rows white, i.e. the default table formatting, for the days less than the Previous Month (15th).
Here is what the theory looks like:
And here is what the application looks like. You can see that rows have been highlighted for the dates between July 15, 2021 though August 15, 2021.
Here is the expressions for Current Month (15th):
And here is the expression for the Previous Month (15th). Notice how we will have to account for the calendar rollover. If the current month is January then we will need to return December of the previous year. You can see in the screenshot below that you can perform addition or subtraction within the parameter expression since both Month() and Year() operators return numeric values.
You can easily create additional calculated data items to test the logic. I didn’t really need to test the December logic for the previous month but I did just incase I decided to do something with the next month logic.
Summary
You now have several examples of how to use a date data item that you constructed with the DateFromMDY(M,D,Y) operator and how to dynamically generate today’s date as well as previous or next values.
For additional date examples refer to one of the below references:
- How to prompt for a date range in a SAS Visual Analytics report series:
- Use parameters to highlight data points in VA reports: Article | YouTube
- VA 7.4: Configure Report or Section Level Cascading Prompts
- VA 8.1: Cascading Prompts as Report and Page Prompts
- VA 8.1 Makes Report and Page Prompts Easy With Auto Controls
- SAS Visual Analytics 8.1: Configuring prompts with different source data: Article | YouTube
- Pick your prompt placement! New control placement option in Visual Analytics 8.4
- VA Report Example: Moving 30 Day Rolling Sum
- Use the latest date in your VA report
- VA Report Example: Number of Days Profitable for the last 30 days
- Using Date Parameters in your SAS Visual Analytics Reports
- SAS Demo | Add Scope to an Aggregated Measure in SAS Visual Analytics
- Mark as Read
- Mark as New
- Bookmark
- Permalink
- Report Inappropriate Content
hello Teri,
your blogs always bring a lot of clarity on the topic. I am struggeling with usage of prompts. There was a request to add 8 prompts on one page as month week, country, category and other smaller hierachies of categories. Is it possible to explain how to build it so that they are connected( I do not want to be able to select a certain country if there was no sales for that). I had disscussion with my collagues about usage of page prompts and we came to conslusion that they will limit us to much as we do not want everything to be filtered by everythig. Instead we will use propmts and through actions define for which tables they are valid. Could you bring some clarity how to use prompts if there are many, about the dependenties and how to define actions? Some people start to define actions for prompts from the left to right, so from the smallest hierarchy to the broadest. I would like to know what the best practice is. If it is possible for you to write a blog about it or point me to one. Thank you and regards Karolina T.
- Mark as Read
- Mark as New
- Bookmark
- Permalink
- Report Inappropriate Content
Hi Karolina,
In looking through my past blogs, it seems it might be time to write an updated cascading prompt article! In the mean time, I have a YouTube and a blog that covers how to do this in VA 7.4. In principle, it is still the same and you can use the View Diagram from the Actions pane to define the filter action between the prompts that you want to define a dependency for.
As for best practices on the order in which to define the dependency, this is usually dictated by the design of the report and how your users would expect to narrow down the scope of data. No correct answer here, the aim is to make the report as user friendly and intuitive as possible.
Thank you,
Teri
- Mark as Read
- Mark as New
- Bookmark
- Permalink
- Report Inappropriate Content
Thanks a lot, have a great weekend!
April 27 – 30 | Gaylord Texan | Grapevine, Texas
Registration is open
Walk in ready to learn. Walk out ready to deliver. This is the data and AI conference you can't afford to miss.
Register now and save with the early bird rate—just $795!
SAS AI and Machine Learning Courses
The rapid growth of AI technologies is driving an AI skills gap and demand for AI talent. Ready to grow your AI literacy? SAS offers free ways to get started for beginners, business leaders, and analytics professionals of all skill levels. Your future self will thank you.
- Find more articles tagged with:
- GEL


