- Home
- /
- Programming
- /
- Graphics
- /
- small multiple maps
- RSS Feed
- Mark Topic as New
- Mark Topic as Read
- Float this Topic for Current User
- Bookmark
- Subscribe
- Mute
- Printer Friendly Page

- Mark as New
- Bookmark
- Subscribe
- Mute
- RSS Feed
- Permalink
- Report Inappropriate Content
Hi,
I would like to produce small multiple maps, but I was unable to find suggestions.
I would appreciate some guidance on the steps needed.
Is there any solution with statistical graphics?
thank you in advance!
Accepted Solutions

- Mark as New
- Bookmark
- Subscribe
- Mute
- RSS Feed
- Permalink
- Report Inappropriate Content
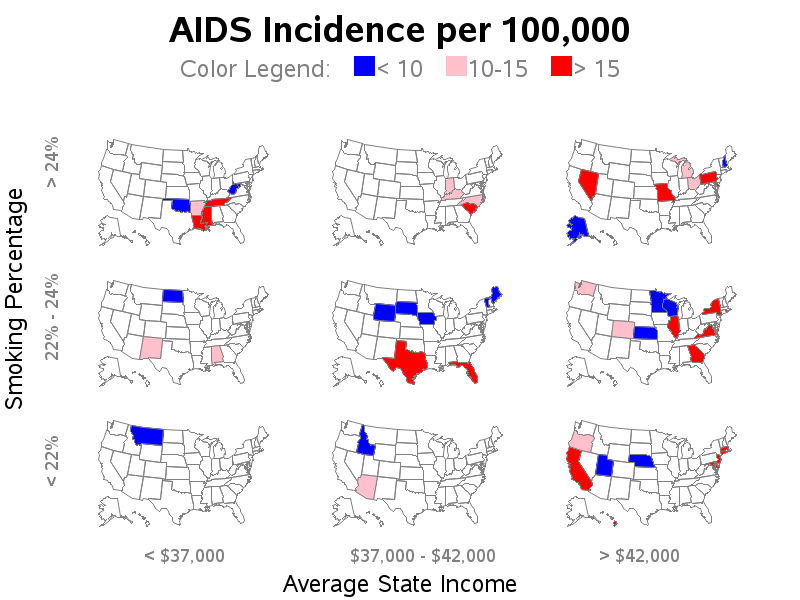
In addition to the technique Sanjay mentioned, if you want to use SAS' premiere mapping procedure (proc Gmap), here are some alternatives...
If you have a set number of maps in your grid, you could create each map separately, and then use Proc Greplay to place them all on the same page, in a custom Greplay template that you design with the layout you want.
If you're going to be viewing the output in a web browser, you can use "ods htmlpanel" to place several maps on the same web page.
And here's an example where I get a little trickier... Rather than using greplay or htmlpanel, I actually duplicate the map
several times, with numeric x/y offsets to make the maps show up beside of each other.
SAS/Graph grid-of-maps (age/smoking/income) - Custom SAS/Graph gmap
http://www.robslink.com/SAS/democd42/mapgrid_info.htm

- Mark as New
- Bookmark
- Subscribe
- Mute
- RSS Feed
- Permalink
- Report Inappropriate Content
It all depends on what you want to do and the release of SAS you are using. With SAS 9.4M1, you can use the polygon plot to draw maps from any polygonal data set including from the MAPS library. With earlier releases, you can still create outline maps.
But "Small Multiples" can include many different cases so you will need to be more specific. Preferably point to an example on the web, or a sketch of what you want and the data you have.
- Mark as New
- Bookmark
- Subscribe
- Mute
- RSS Feed
- Permalink
- Report Inappropriate Content
I am running 9.4 M1
The kind of graph I'am trying to produce is similar to the one at the bottom of this page:
AllAnalytics - Jonathan Schwabish - Get Visual With Small Multiples
Actually I dont' need so many maps, more in the range 6-12. And each subgraph should have only one "title", that is I a matrix-like structure is not needed. at the bottom of the whole graph there should be the legend with the colors used.
- Mark as New
- Bookmark
- Subscribe
- Mute
- RSS Feed
- Permalink
- Report Inappropriate Content
In addition to the technique Sanjay mentioned, if you want to use SAS' premiere mapping procedure (proc Gmap), here are some alternatives...
If you have a set number of maps in your grid, you could create each map separately, and then use Proc Greplay to place them all on the same page, in a custom Greplay template that you design with the layout you want.
If you're going to be viewing the output in a web browser, you can use "ods htmlpanel" to place several maps on the same web page.
And here's an example where I get a little trickier... Rather than using greplay or htmlpanel, I actually duplicate the map
several times, with numeric x/y offsets to make the maps show up beside of each other.
SAS/Graph grid-of-maps (age/smoking/income) - Custom SAS/Graph gmap
http://www.robslink.com/SAS/democd42/mapgrid_info.htm

- Mark as New
- Bookmark
- Subscribe
- Mute
- RSS Feed
- Permalink
- Report Inappropriate Content
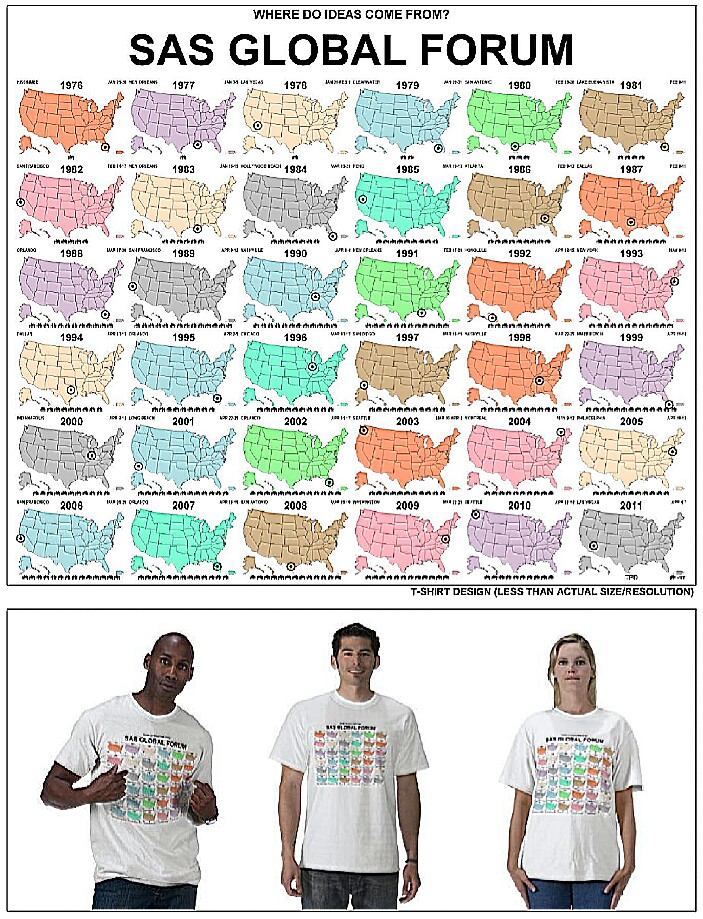
This doesn't do eveything you're looking for, but check out this old SGF paper, which I cobbled together after reading Robert's useful how-to examples:
Fit-to-aT: Using SAS® to Create a SAS® Global Forum 2011 T-Shirt
http://support.sas.com/resources/papers/proceedings11/220-2011.pdf
- Mark as New
- Bookmark
- Subscribe
- Mute
- RSS Feed
- Permalink
- Report Inappropriate Content
Thank you guys, I am in the process of trying your techniques.
- Mark as New
- Bookmark
- Subscribe
- Mute
- RSS Feed
- Permalink
- Report Inappropriate Content
okay, here is where I am stuck..
after defining with pattern statements the colors I would like to use, I had produced maps with by group processing. Each by group is a sector.
after that the plan was to put individual graphs in a greplay template to show small multiples.
however for each by group sas uses only some of the colors I have set, while I would like it assigned a precise color to each range, so that comparisons can be made across individual maps.
here is the kind of code I am using.
proc format;
value map2fmt
.='No Data'
low-20='<=20'
20<-22='20<-22'
22<-24='22<-24'
24<-26='24<-26'
26<-28='26<-28'
28<-30='28<-30'
30<-32='30<-32'
32<-34='32<-34'
34<-36='34<-36'
36<-38='36<-38'
38<-40='38<-40'
40<-high='>40'
;
run;
goptions reset=all;
goptions ftext=swiss ftitle=swiss xpixels = 1600 ypixels = 1200 ;
%patterns(%bquote(&ramp));
proc gmap data=estimates map=country all ;
by sector;
format ch map2fmt.;
id id;
choro ch / coutline=black discrete name="gra" anno=centeranno;
run;
quit;
any help is greatly appreciated.
- Mark as New
- Bookmark
- Subscribe
- Mute
- RSS Feed
- Permalink
- Report Inappropriate Content
I would recommend putting the data into 'buckets' and then specifying all those buckets in the gmap midpoints= option.
This technique is described in the "Custom Color Binning" example in the following chapter:
- Mark as New
- Bookmark
- Subscribe
- Mute
- RSS Feed
- Permalink
- Report Inappropriate Content
thanks robert!
it works very well now.
I am heading now towards the greplay part.
- Mark as New
- Bookmark
- Subscribe
- Mute
- RSS Feed
- Permalink
- Report Inappropriate Content
Ok, I am implementing the greplaying of the maps in a 3*2 template.
I am following the paper]Effective SAS greplay'ing and how to avoid stretching
the final aim is to insert the figure in a ms-word document.
I have two problems now:
1. the device emf erase part of the graph in the emf file (not in the sas output, where however the graph is in the landscape instad of portrait!)
gif device works, but I might have the necessity to resize the graph in word.
2. I don't know how to have a common legend. I read the following:
24945 - Replay graphs with a common title and legend with PROC GREPLAY
but how can i adapt it to gmap?
here is my code up to now:
ods graphics off;
ods hml close;
ods listing;
proc greplay nofs igout=work.gseg;
delete _all_;
run;
quit;
filename outgs 'G:\temp';
title;title2;
goptions reset=all;
goptions ymax=6.4cm ypixels=640 xmax=9cm xpixels=900;
goptions device=emf htext=0.35cm ftext=simplex;
%patterns(%bquote(&ramp));
proc gmap data=ds map=mapcoordinates all gout=work.tempcat;
by attecon;
id id;
choro bucket / midpoints='a' 'b' 'c' 'd' 'e' 'f' 'g' 'h' 'i'
coutline=black name="ita" anno=centeranno nolegend;
run;
quit;
proc greplay tc=work.tempcat nofs;
tdef newtemp des='Six panel template'
1/ulx=0 uly=91
urx=50 ury=91
llx=0 lly=64
lrx=50 lry=64
2/ulx=50 uly=91
urx=100 ury=91
llx=50 lly=64
lrx=100 lry=64
3/ulx=0 uly=64
urx=50 ury=64
llx=0 lly=37
lrx=50 lry=37
4/ulx=50 uly=64
urx=100 ury=64
llx=50 lly=37
lrx=100 lry=37
5/ulx=0 uly=37
urx=50 ury=37
llx=0 lly=10
lrx=50 lry=10
6/ulx=50 uly=37
urx=100 ury=37
llx=50 lly=10
lrx=100 lry=10;
run;
quit;
goptions ymax=24cm ypixels=2400 xmax=18cm xpixels=1800;
filename gsasfile 'G:\temp\completemap.emf';
goptions gsfname=gsasfile gsfmode=replace;
proc greplay tc=work.tempcat nofs;
template newtemp;
igout work.tempcat;
treplay 1:MAP20
2:MAP8
3:MAP4
4:MAP19
5:MAP26
6:MAP27;
;
run;
quit;
thank you very much for any help!
- Mark as New
- Bookmark
- Subscribe
- Mute
- RSS Feed
- Permalink
- Report Inappropriate Content
For your common legend, you might want to just create that manually using annotate on a Proc Gslide, or something like that.
I haven't used emf, so I'm not sure what advice to give you there.
- Mark as New
- Bookmark
- Subscribe
- Mute
- RSS Feed
- Permalink
- Report Inappropriate Content
Thank you very much Robert, I'll try it. And thanks to everybody. This forum is just awesome.
.jpg")
Catch up on SAS Innovate 2026
Nearly 200 sessions are now available on demand in the Innovate Hub.
Watch Now →Learn how use the CAT functions in SAS to join values from multiple variables into a single value.

Find more tutorials on the SAS Users YouTube channel.
SAS Training: Just a Click Away
Ready to level-up your skills? Choose your own adventure.
-
11 replies
-
11-19-2014 05:25 PM
-
7806 views
-
9 likes
-
4 in conversation
-
