- Home
- /
- Programming
- /
- Graphics
- /
- proc gchart with blank vbars for zero frequency records
- RSS Feed
- Mark Topic as New
- Mark Topic as Read
- Float this Topic for Current User
- Bookmark
- Subscribe
- Mute
- Printer Friendly Page

- Mark as New
- Bookmark
- Subscribe
- Mute
- RSS Feed
- Permalink
- Report Inappropriate Content
Hi,
i would like to generate the vbar with proc gchart where i would like to display the blank vbar for those which are not there in data. For example, from the below data i will get the vbar char for india, japan, usa, china depending upon the number of records there are in the data, however i will need to display atleast in the label on maxis other countries but with no vbar as those countries records are not in the data. like i need to display korea in maxis label but no vbar.
data have;
input countrycd country$;
cards;
1 india
1 india
1 india
1 india
2 japan
2 japan
3 usa
4 china
4 china
4 china
;
run;
axis1 value=('india' 'japan' 'usa' 'china' 'korea') ;
proc gchart data=have;
vbar country / discrete maxis=axis1;
run;
quit;

Thanks,
Jag
Jag
Accepted Solutions

- Mark as New
- Bookmark
- Subscribe
- Mute
- RSS Feed
- Permalink
- Report Inappropriate Content
Instead of putting those values on the AXIS statement, put them on the MIDPOINTS option of the VBAR statement:
proc gchart data=have;
vbar country / discrete midpoints=('india' 'japan' 'usa' 'china' 'korea');
run;
quit;
Hope this helps!
Dan
- Mark as New
- Bookmark
- Subscribe
- Mute
- RSS Feed
- Permalink
- Report Inappropriate Content
Thank you Dan for your response and it helped me.
In continuation to the above discussion, i would like to check with you , how we could create blank vbar for subgroup and group if the subgroup and group records are missing. To explain further, consider that we have category and sub-category as below
data have;
input subcat$ cat$;
cards;
A india
A india
A india
A india
B japan
B japan
C usa
A china
A china
A china
;
run;
proc gchart data=have;
vbar subcat / discrete group=cat subgroup=subcat ;
run;
quit;
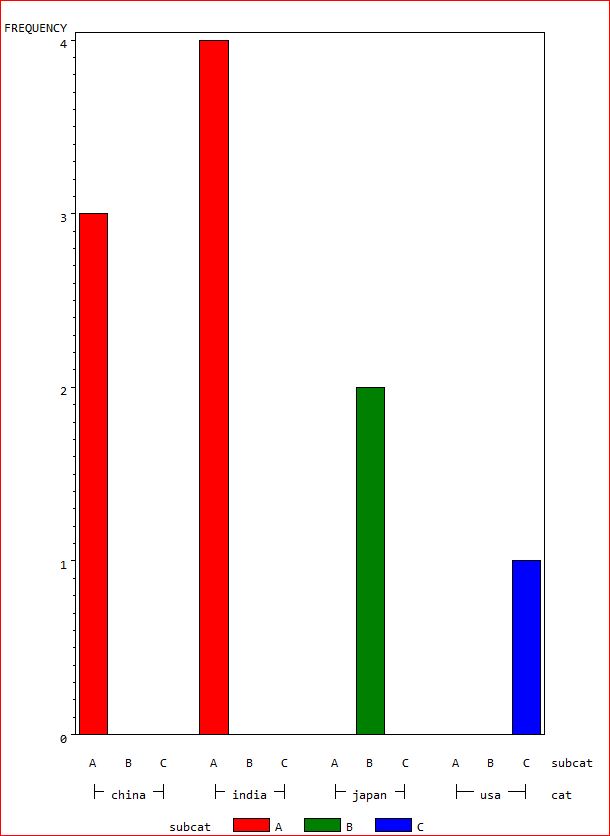
This generates a graph as above, however if would like to create a blank vbar for korea with same subgroups. For this , should i need to create dummy records for korea in the data
or is there anything similar to midpoints. Please suggest.
Thanks,
Jag
Jag
- Mark as New
- Bookmark
- Subscribe
- Mute
- RSS Feed
- Permalink
- Report Inappropriate Content
I think this will work for you:
axis1 order=("china" "india" "japan" "korea" "usa");
proc gchart data=have;
vbar subcat / discrete group=cat subgroup=subcat gaxis=axis1;
run;
quit;
- Mark as New
- Bookmark
- Subscribe
- Mute
- RSS Feed
- Permalink
- Report Inappropriate Content
Thank you Dan it helped
Jag
.jpg")
Catch up on SAS Innovate 2026
Nearly 200 sessions are now available on demand in the Innovate Hub.
Watch Now →Learn how use the CAT functions in SAS to join values from multiple variables into a single value.

Find more tutorials on the SAS Users YouTube channel.
SAS Training: Just a Click Away
Ready to level-up your skills? Choose your own adventure.
-
4 replies
-
11-30-2014 08:28 AM
-
4289 views
-
1 like
-
2 in conversation
-
