- Home
- /
- Programming
- /
- Graphics
- /
- proc gchart with blank vbars for zero frequency records
- RSS Feed
- Mark Topic as New
- Mark Topic as Read
- Float this Topic for Current User
- Bookmark
- Subscribe
- Mute
- Printer Friendly Page

- Mark as New
- Bookmark
- Subscribe
- Mute
- RSS Feed
- Permalink
- Report Inappropriate Content
Hi,
i would like to generate the vbar with proc gchart where i would like to display the blank vbar for those which are not there in data. For example, from the below data i will get the vbar char for india, japan, usa, china depending upon the number of records there are in the data, however i will need to display atleast in the label on maxis other countries but with no vbar as those countries records are not in the data. like i need to display korea in maxis label but no vbar.
data have;
input countrycd country$;
cards;
1 india
1 india
1 india
1 india
2 japan
2 japan
3 usa
4 china
4 china
4 china
;
run;
axis1 value=('india' 'japan' 'usa' 'china' 'korea') ;
proc gchart data=have;
vbar country / discrete maxis=axis1;
run;
quit;

Thanks,
Jag
Jag
Accepted Solutions

- Mark as New
- Bookmark
- Subscribe
- Mute
- RSS Feed
- Permalink
- Report Inappropriate Content
Instead of putting those values on the AXIS statement, put them on the MIDPOINTS option of the VBAR statement:
proc gchart data=have;
vbar country / discrete midpoints=('india' 'japan' 'usa' 'china' 'korea');
run;
quit;
Hope this helps!
Dan
- Mark as New
- Bookmark
- Subscribe
- Mute
- RSS Feed
- Permalink
- Report Inappropriate Content
Thank you Dan for your response and it helped me.
In continuation to the above discussion, i would like to check with you , how we could create blank vbar for subgroup and group if the subgroup and group records are missing. To explain further, consider that we have category and sub-category as below
data have;
input subcat$ cat$;
cards;
A india
A india
A india
A india
B japan
B japan
C usa
A china
A china
A china
;
run;
proc gchart data=have;
vbar subcat / discrete group=cat subgroup=subcat ;
run;
quit;
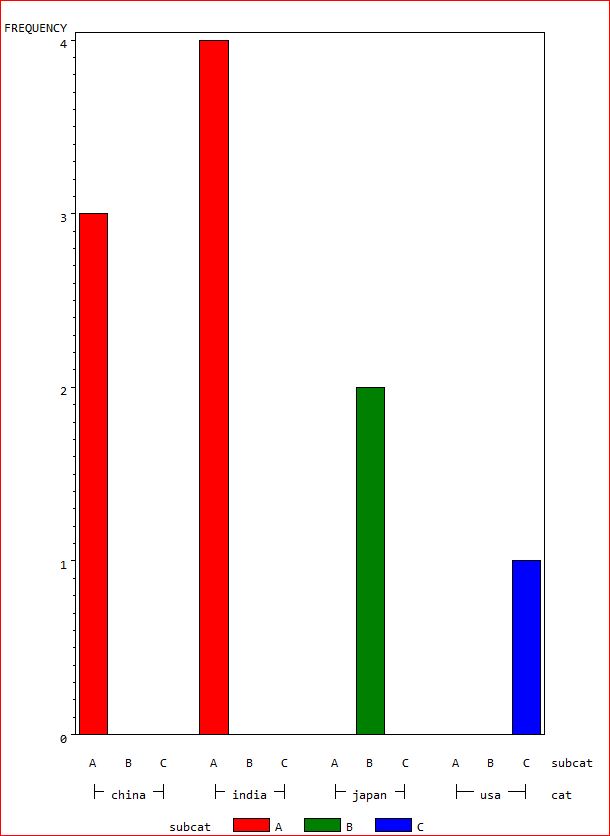
This generates a graph as above, however if would like to create a blank vbar for korea with same subgroups. For this , should i need to create dummy records for korea in the data
or is there anything similar to midpoints. Please suggest.
Thanks,
Jag
Jag
- Mark as New
- Bookmark
- Subscribe
- Mute
- RSS Feed
- Permalink
- Report Inappropriate Content
I think this will work for you:
axis1 order=("china" "india" "japan" "korea" "usa");
proc gchart data=have;
vbar subcat / discrete group=cat subgroup=subcat gaxis=axis1;
run;
quit;
- Mark as New
- Bookmark
- Subscribe
- Mute
- RSS Feed
- Permalink
- Report Inappropriate Content
Thank you Dan it helped
Jag
.jpg")
Catch up on SAS Innovate 2026
Nearly 200 sessions are now available on demand with the SAS Innovate Digital Pass.
Explore Now →Learn how use the CAT functions in SAS to join values from multiple variables into a single value.

Find more tutorials on the SAS Users YouTube channel.
SAS Training: Just a Click Away
Ready to level-up your skills? Choose your own adventure.
-
4 replies
-
11-30-2014 08:28 AM
-
4249 views
-
1 like
-
2 in conversation
-
