- Home
- /
- Programming
- /
- Graphics
- /
- Re: Various scales on axes proc sgpanel (SAS 9.3)
- RSS Feed
- Mark Topic as New
- Mark Topic as Read
- Float this Topic for Current User
- Bookmark
- Subscribe
- Mute
- Printer Friendly Page

- Mark as New
- Bookmark
- Subscribe
- Mute
- RSS Feed
- Permalink
- Report Inappropriate Content
Hi,
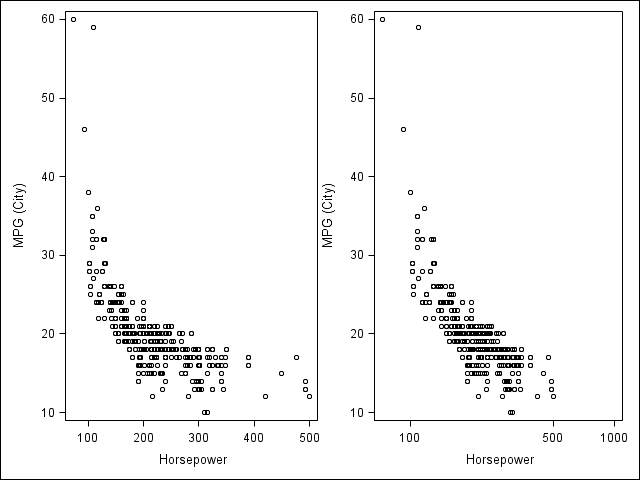
I want to create a two-panel graph using proc sgpanel in SAS 9.3. The y-axis should be the same for the two panels, but I want one x-axis to be on a linear scale and the other on a logarithmic scale (expand). Can that be done in 9.3, or do you have any other way to create this type of graph?
Best regards,
Tommy
Accepted Solutions

- Mark as New
- Bookmark
- Subscribe
- Mute
- RSS Feed
- Permalink
- Report Inappropriate Content
Hi Tommy,
You can use GTL to do this, below is an example.
proc template;
define statgraph plot_linearlog;
begingraph;
layout lattice / rows = 1 columns = 2;
layout overlay / xaxisopts=(type = linear);
scatterplot x = Horsepower y = MPG_City;
endlayout;
layout overlay / xaxisopts=(type = log logopts = (tickintervalstyle = logexpand));
scatterplot x = Horsepower y = MPG_City;
endlayout;
endlayout;
endgraph;
end;
run;
proc sgrender data = sashelp.cars template = plot_linearlog;
run;
- Mark as New
- Bookmark
- Subscribe
- Mute
- RSS Feed
- Permalink
- Report Inappropriate Content
Thanks djrisks, you opened up a new world for me when introducing GLT. A little bit tricky to sort it all out, but I could create the graph exactly as I wanted.
Tommy
- Mark as New
- Bookmark
- Subscribe
- Mute
- RSS Feed
- Permalink
- Report Inappropriate Content
That's fine Tommy / Chris. I agree GTL is a lot more powerful and tricky, and I'm glad you were able to figure it out and create the graph exactly as you wanted.
.jpg")
Catch up on SAS Innovate 2026
Nearly 200 sessions are now available on demand with the SAS Innovate Digital Pass.
Explore Now →Learn how use the CAT functions in SAS to join values from multiple variables into a single value.

Find more tutorials on the SAS Users YouTube channel.
SAS Training: Just a Click Away
Ready to level-up your skills? Choose your own adventure.
-
3 replies
-
03-09-2015 05:47 AM
-
4311 views
-
0 likes
-
2 in conversation
-
