- Home
- /
- Programming
- /
- Graphics
- /
- Specify y axis max in SGPLOT
- RSS Feed
- Mark Topic as New
- Mark Topic as Read
- Float this Topic for Current User
- Bookmark
- Subscribe
- Mute
- Printer Friendly Page

- Mark as New
- Bookmark
- Subscribe
- Mute
- RSS Feed
- Permalink
- Report Inappropriate Content
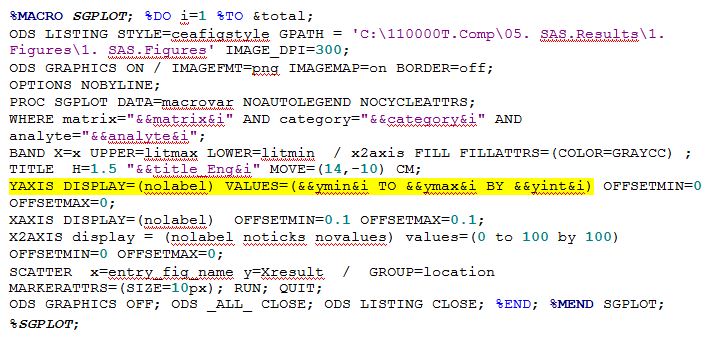
I'm using an macro in SGPLOT to create graphs (code attached) and I want to specify the minimum and maximum values of the y axis.
Data for the graphs comes from the data set macrovar, which includes the variables Ymin, Ymax, and Yint.
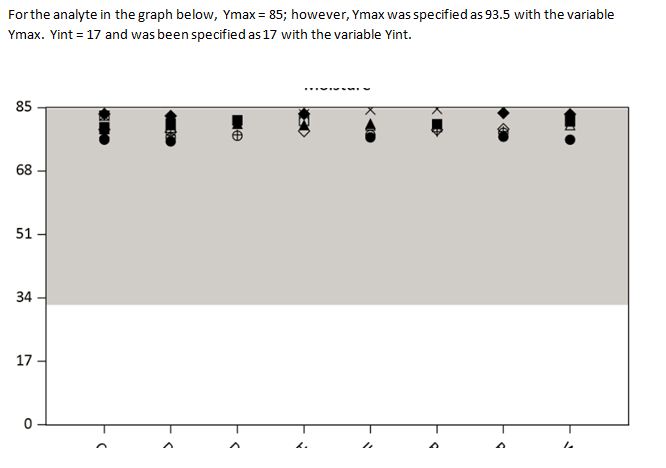
When the graphs are created, they have the interval that I have specified with Yint, but the maximum value for the Yaxis is not what I have specified with the Ymax variable.
In the attached example graph, the maximum is just a little bit above 85. However, I have specified that the max for the Y axis needs to be 93.5. Why is it not using the values I have specified for Ymax? Any help figuring this out would be greatly appreciated!

- Mark as New
- Bookmark
- Subscribe
- Mute
- RSS Feed
- Permalink
- Report Inappropriate Content
Fastb,
Hypothesis to verify!
1)Was there an interaction between your title defined with a title area with move(14,-10) ?
2)what happens if you change into ods graphics /height=20 cm;
3) an effect of offsets ?
Andre

- Mark as New
- Bookmark
- Subscribe
- Mute
- RSS Feed
- Permalink
- Report Inappropriate Content
I believe you are using the right (VALUES) option. You could additionally try the MIN and MAX options on the Y axis. Hard to say without the data and with the macro variables.

- Mark as New
- Bookmark
- Subscribe
- Mute
- RSS Feed
- Permalink
- Report Inappropriate Content
If you add the VALUESHINT option, I believe you will get what you want. By default, the axis will be constrained by the min/max values in the VALUES option. However, if you also specify VALUESHINT, the axis will not be constrained, and the tick values from the VALUES option that fall within the axis range will be drawn.
Hope this helps!
Dan
.jpg")
Catch up on SAS Innovate 2026
Nearly 200 sessions are now available on demand with the SAS Innovate Digital Pass.
Explore Now →Learn how use the CAT functions in SAS to join values from multiple variables into a single value.

Find more tutorials on the SAS Users YouTube channel.
SAS Training: Just a Click Away
Ready to level-up your skills? Choose your own adventure.
-
3 replies
-
03-05-2013 10:28 PM
-
13479 views
-
0 likes
-
4 in conversation
-
