- Home
- /
- Programming
- /
- Graphics
- /
- Re: Show data points in Stack bar graph
- RSS Feed
- Mark Topic as New
- Mark Topic as Read
- Float this Topic for Current User
- Bookmark
- Subscribe
- Mute
- Printer Friendly Page
- Mark as New
- Bookmark
- Subscribe
- Mute
- RSS Feed
- Permalink
- Report Inappropriate Content
Hi,
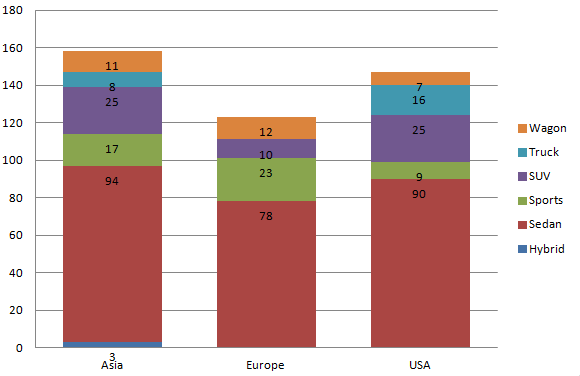
Currently I have created a stack bar graph where bar value is showed on top of each bar.

But how can I show data labels for each stack group? Something as shown below:

Following SAS code I used to generate first graph (without data label):
PROC SQL;
CREATE VIEW WORK.SORTTempTableSorted AS
SELECT T.Origin, T.Type
FROM SASHELP.CARS as T;
QUIT;
Legend1
FRAME
POSITION = (MIDDLE RIGHT OUTSIDE)
;
Axis1
STYLE=1
WIDTH=1
MINOR=
(NUMBER=1
)
;
Axis2
STYLE=1
WIDTH=1
;
PROC GCHART DATA=WORK.SORTTempTableSorted
;
VBAR3D
Origin
/
SUBGROUP=Type
SHAPE=BLOCK
FRAME TYPE=FREQ
FREQ
LEGEND=LEGEND1
COUTLINE=BLACK
RAXIS=AXIS1
MAXIS=AXIS2
;
RUN; QUIT;
- Mark as New
- Bookmark
- Subscribe
- Mute
- RSS Feed
- Permalink
- Report Inappropriate Content
What version of SAS are you using?
- Mark as New
- Bookmark
- Subscribe
- Mute
- RSS Feed
- Permalink
- Report Inappropriate Content
If you have SAS9.4M2, you can use the new SEGLABEL option to show label for each segment.
For prior releases, see:
http://blogs.sas.com/content/graphicallyspeaking/2013/09/20/stacked-bar-chart-with-segment-labels/
April 27 – 30 | Gaylord Texan | Grapevine, Texas
Registration is open
Walk in ready to learn. Walk out ready to deliver. This is the data and AI conference you can't afford to miss.
Register now and save with the early bird rate—just $795!
Learn how use the CAT functions in SAS to join values from multiple variables into a single value.
Find more tutorials on the SAS Users YouTube channel.
SAS Training: Just a Click Away
Ready to level-up your skills? Choose your own adventure.


