- Home
- /
- Programming
- /
- Graphics
- /
- Re: Remove X axis title sgplot
- RSS Feed
- Mark Topic as New
- Mark Topic as Read
- Float this Topic for Current User
- Bookmark
- Subscribe
- Mute
- Printer Friendly Page


- Mark as New
- Bookmark
- Subscribe
- Mute
- RSS Feed
- Permalink
- Report Inappropriate Content
Hi,
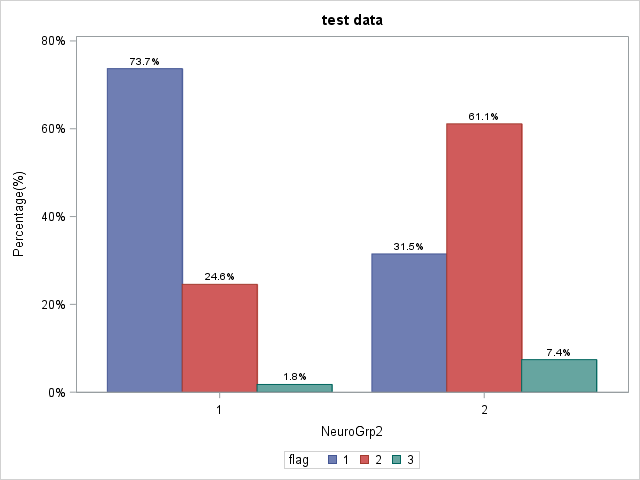
Do you guys know how can I can I remove "NeuroGrp2" in the sgplot output?
Thanks
Accepted Solutions


- Mark as New
- Bookmark
- Subscribe
- Mute
- RSS Feed
- Permalink
- Report Inappropriate Content
XAXIS DISPLAY=(NOLABEL);


- Mark as New
- Bookmark
- Subscribe
- Mute
- RSS Feed
- Permalink
- Report Inappropriate Content
Try setting the label to missing?
Your code may help.
label NeuroGrp2='';Otherwise you can use an XAXIS statement and control it from there.
@JB_DataAnalyst wrote:
Hi,
Do you guys know how can I can I remove "NeuroGrp2" in the sgplot output?
Thanks
- Mark as New
- Bookmark
- Subscribe
- Mute
- RSS Feed
- Permalink
- Report Inappropriate Content
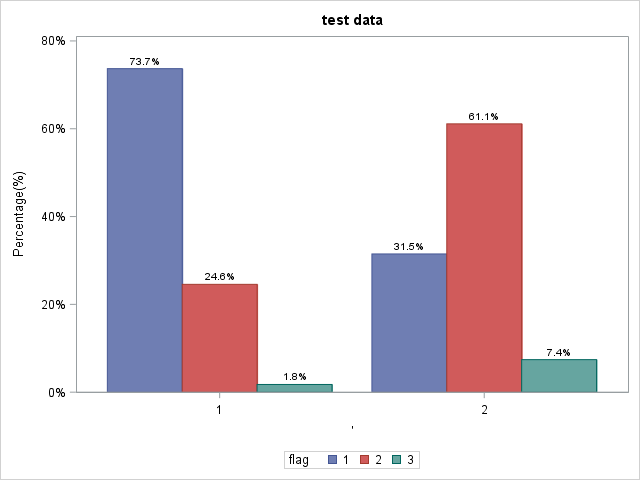
Thanks Reeza,
however this is the output.
- Mark as New
- Bookmark
- Subscribe
- Mute
- RSS Feed
- Permalink
- Report Inappropriate Content
- Mark as New
- Bookmark
- Subscribe
- Mute
- RSS Feed
- Permalink
- Report Inappropriate Content
proc sgplot data=test;
Title "test data";
yaxis label="Percentage(%)" min=0 max=.8;
xaxis label="";
label NeuroGrp2='';
vbar NeuroGrp2 / response=pct2 group=flag groupDisplay=cluster datalabel;
run;

- Mark as New
- Bookmark
- Subscribe
- Mute
- RSS Feed
- Permalink
- Report Inappropriate Content
Xaxis nolabel;

- Mark as New
- Bookmark
- Subscribe
- Mute
- RSS Feed
- Permalink
- Report Inappropriate Content
Add some blanks in quote.
label NeuroGrp2=' ';- Mark as New
- Bookmark
- Subscribe
- Mute
- RSS Feed
- Permalink
- Report Inappropriate Content
XAXIS DISPLAY=(NOLABEL);
- Mark as New
- Bookmark
- Subscribe
- Mute
- RSS Feed
- Permalink
- Report Inappropriate Content
This one works!!
XAXIS DISPLAY=(NOLABEL);
Thank you very much! 🙂

Call for content now open!
It's your turn to help shape SAS Innovate 2027. Share your expertise and inspire the SAS community.
Learn how use the CAT functions in SAS to join values from multiple variables into a single value.

Find more tutorials on the SAS Users YouTube channel.
SAS Training: Just a Click Away
Ready to level-up your skills? Choose your own adventure.
-
8 replies
-
07-18-2018 02:49 PM
-
25462 views
-
4 likes
-
5 in conversation
-


