- Home
- /
- Programming
- /
- Graphics
- /
- Re: Multiple plots with different vertical bars
- RSS Feed
- Mark Topic as New
- Mark Topic as Read
- Float this Topic for Current User
- Bookmark
- Subscribe
- Mute
- Printer Friendly Page
- Mark as New
- Bookmark
- Subscribe
- Mute
- RSS Feed
- Permalink
- Report Inappropriate Content
Hello,

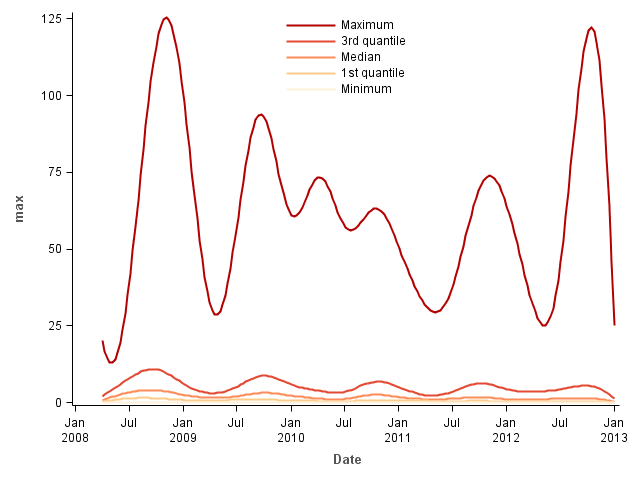
proc sgplot data=_5A;
pbspline x=Date y=max / nomarkers lineattrs=(color=cxB30000) legendlabel="Maximum";
pbspline x=Date y=q3 / nomarkers lineattrs=(color=cxE34A33) legendlabel="3rd quantile";
pbspline x=Date y=median / nomarkers lineattrs=(color=cxFC8D59) legendlabel="Median";
pbspline x=Date y=q1 / nomarkers lineattrs=(color=cxFDCC8A) legendlabel="1st quantile";
pbspline x=Date y=min / nomarkers lineattrs=(color=cxFEF0D9) legendlabel="Minimum";
keylegend / noborder position=top location=inside across=1;
;run;quit;
This is a time series plot of different values at 20 different dates.
I would like to create 20 different versions of this same plot, each time with one vertical line at the 20 different dates.
- Mark as New
- Bookmark
- Subscribe
- Mute
- RSS Feed
- Permalink
- Report Inappropriate Content
First, depending on what you are trying to model, you might want to consider quantile regression. See Quantile regression: Better than connecting the sample quantiles of binned data - The DO Loop
To answer your question, you could use the SGPANEL procedure with DATE as the PANELBY variable and the orginal (unsummarized) data as the Y variable.
However, you should also consider whether a single plot might suffice. A scatter plot of DATE vs "original Y variable" might give you what you want. An example is in the article that I linked to earlier. Alternatively, to get an easy summarization, you might want to create a VBOX of the original Y variable with CATEGORY=DATE.
- Mark as New
- Bookmark
- Subscribe
- Mute
- RSS Feed
- Permalink
- Report Inappropriate Content
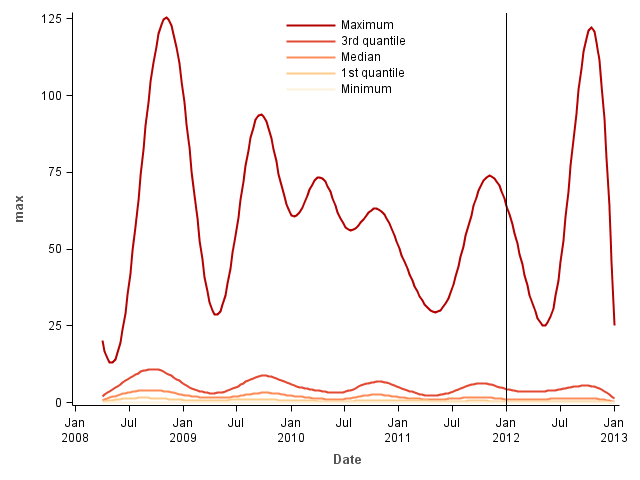
Like this for '01jan2012'd

- Mark as New
- Bookmark
- Subscribe
- Mute
- RSS Feed
- Permalink
- Report Inappropriate Content
You can use SGPLOT with a BY-group to generate the 20 plots; but, instead of using a literal value for the REFLINE, use a variable that contains the reference line values. That way, the reference line position will vary per BY-group.
Hope this helps!
Dan
- Mark as New
- Bookmark
- Subscribe
- Mute
- RSS Feed
- Permalink
- Report Inappropriate Content
Hi,
Thanks for the replies.
- Quantile regression: I don't think this is appropriate for what I intend to do.
- SGplot with by-group does not work. I think it's becasue there is only one date to plot, and then "pbspline x=Date y=max" will not produce any graph.
This produces the intended result, do you think it's efficient ?
%macro krigetimeplot(date);
proc sgplot data=_5A;
pbspline x=Date y=max / nomarkers lineattrs=(color=cxB30000) legendlabel="Maximum";
pbspline x=Date y=q3 / nomarkers lineattrs=(color=cxE34A33) legendlabel="3rd quantile";
pbspline x=Date y=median / nomarkers lineattrs=(color=cxFC8D59) legendlabel="Median";
pbspline x=Date y=q1 / nomarkers lineattrs=(color=cxFDCC8A) legendlabel="1st quantile";
pbspline x=Date y=min / nomarkers lineattrs=(color=cxFEF0D9) legendlabel="Minimum";
keylegend / noborder position=top location=inside across=1;
refline &date / axis=x;
;run;quit;
%mend krigetimeplot;
data _null_; set _5A;
call execute('%krigetimeplot('||Date||')');
run;
April 27 – 30 | Gaylord Texan | Grapevine, Texas
Registration is open
Walk in ready to learn. Walk out ready to deliver. This is the data and AI conference you can't afford to miss.
Register now and save with the early bird rate—just $795!
Learn how use the CAT functions in SAS to join values from multiple variables into a single value.
Find more tutorials on the SAS Users YouTube channel.
SAS Training: Just a Click Away
Ready to level-up your skills? Choose your own adventure.


