- Home
- /
- Programming
- /
- Graphics
- /
- How to show similar plot in one page? SGPANEL? GREPLAY?
- RSS Feed
- Mark Topic as New
- Mark Topic as Read
- Float this Topic for Current User
- Bookmark
- Subscribe
- Mute
- Printer Friendly Page

- Mark as New
- Bookmark
- Subscribe
- Mute
- RSS Feed
- Permalink
- Report Inappropriate Content
I meet a issue in work. client ask a plot like below.
the first way I do is using PROC SGPANEL. But the issue is , I can't show the x-axis and y-axis in each small cell. additional, there is a blank cell at the bottom right. I don't know how to remove it.
the second way, using PROC GPLOT to draw each subject, than use GREPLAY to put them together. but the issue is ,how to draw the legend?
Is anyone have a good solution for this?
thanks a lot!

- Mark as New
- Bookmark
- Subscribe
- Mute
- RSS Feed
- Permalink
- Report Inappropriate Content
Hi,
Try out proc template and GTL as you will have more control.
Also, have a look at this blog which details quite a lot with regards to graphs: http://blogs.sas.com/content/graphicallyspeaking/

- Mark as New
- Bookmark
- Subscribe
- Mute
- RSS Feed
- Permalink
- Report Inappropriate Content
Happydragon,
Robert Allison has some great information on the Web (google); in SAS sites; and in his book "SAS/GRAPH Beyond the basics". I have seen or encountered each of your problems. The documentation by Robert Allison and others helped me solve the problems. Unfortunately, there was no quick fix for my problems.

- Mark as New
- Bookmark
- Subscribe
- Mute
- RSS Feed
- Permalink
- Report Inappropriate Content
Assuming you've got the gplots & greplay looking the way you want, and the only remaining question is the shared legend, here is an example that should be exactly what you need...
http://robslink.com/SAS/democd53/multi_plot.htm
http://robslink.com/SAS/democd53/multi_plot_info.htm
(p.s. - Thanks jwillis!)
- Mark as New
- Bookmark
- Subscribe
- Mute
- RSS Feed
- Permalink
- Report Inappropriate Content
I have visited your website before. There are a lot of example which are useful to us. thanks very much!
You link is a good way to resolve by gplot and greplay.
But I am more interested in GTL. Because I have got original plot by GPANEL. the plot is much more complex than the sample I show. it will be a lot work to change it to use gplot.
About GTL, which layout should I chose? I have look into the GTL early. for multi-cell layouts, LATTICE can be use. but in documents, 'All cells must be predefined'. does this mean I have to define 5 times if there are 5 cells in one graph? And in early test, if I define 2 cells, and if there is no data for second cell, the blank frame will still show.
about DATAPANEL and DATALATTICE, it is sample. But I think this is same as SGPANEL, right?

- Mark as New
- Bookmark
- Subscribe
- Mute
- RSS Feed
- Permalink
- Report Inappropriate Content
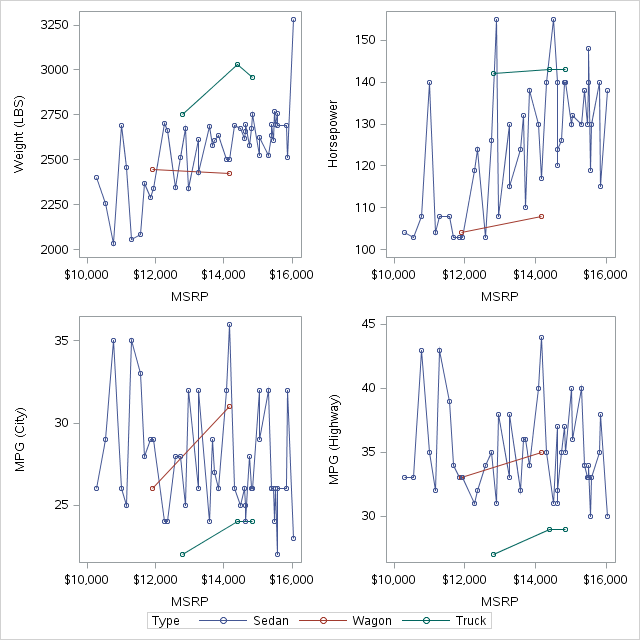
You best choice for this type of plot is PROC SGSCATTER.
proc sort data=sashelp.cars out=cars; by msrp; run;
proc sgscatter data=cars (obs=50);
plot (weight horsepower mpg_city mpg_highway)*msrp / group=type join;
run;
- Mark as New
- Bookmark
- Subscribe
- Mute
- RSS Feed
- Permalink
- Report Inappropriate Content
After looking at your example further, it looks like you need reference lines, which are not currently supported in SGSCATTER. Therefore, you would need to use either GTL or the GPLOT/GREPLAY combo.
- Mark as New
- Bookmark
- Subscribe
- Mute
- RSS Feed
- Permalink
- Report Inappropriate Content
Yes. actually, each small plot is more complex than the sample. I think it can't support by SGSCATTER.
And I am more interested in GTL.
- Mark as New
- Bookmark
- Subscribe
- Mute
- RSS Feed
- Permalink
- Report Inappropriate Content
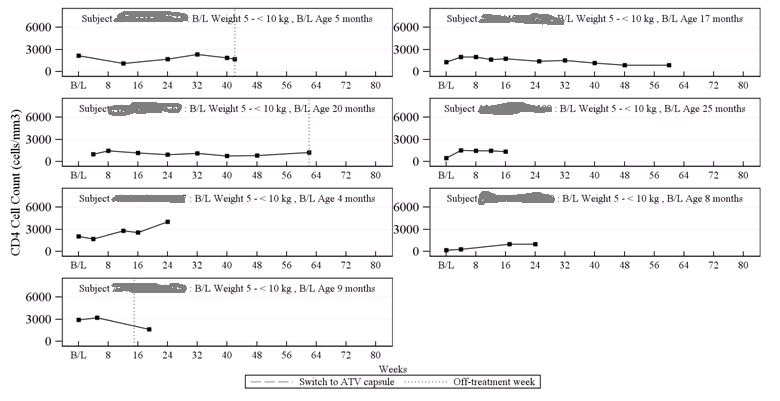
Here is another graph I need to draw. it is more complex. I created it by SGPANEL. but at last page, there is a blank cell which need be removed. and client ask to add x-axis if it is possible. So I try to resolve it by GTL.

.jpg")
Catch up on SAS Innovate 2026
Nearly 200 sessions are now available on demand with the SAS Innovate Digital Pass.
Explore Now →Learn how use the CAT functions in SAS to join values from multiple variables into a single value.

Find more tutorials on the SAS Users YouTube channel.
SAS Training: Just a Click Away
Ready to level-up your skills? Choose your own adventure.
-
8 replies
-
05-14-2014 08:40 AM
-
4552 views
-
0 likes
-
5 in conversation
-
