- Home
- /
- Programming
- /
- Graphics
- /
- Can Proc SGPlot generate the slope value of a regression line?
- RSS Feed
- Mark Topic as New
- Mark Topic as Read
- Float this Topic for Current User
- Bookmark
- Subscribe
- Mute
- Printer Friendly Page

- Mark as New
- Bookmark
- Subscribe
- Mute
- RSS Feed
- Permalink
- Report Inappropriate Content
I'm using proc sgplot with the reg option to generate a number of related plots. Is there a way to get proc sgplot to generate the slope of the regression line for me, so that I can compare the slopes of different plots? Or do I have to go run PROC REG? separately to have the system calculate the slope?
Accepted Solutions

- Mark as New
- Bookmark
- Subscribe
- Mute
- RSS Feed
- Permalink
- Report Inappropriate Content
Here's an example using gplot's "regeqn" option.
I'll have to let someone else answer whether sgplot has such an option.
proc sort data=sashelp.class out=foo;
by sex;
run;
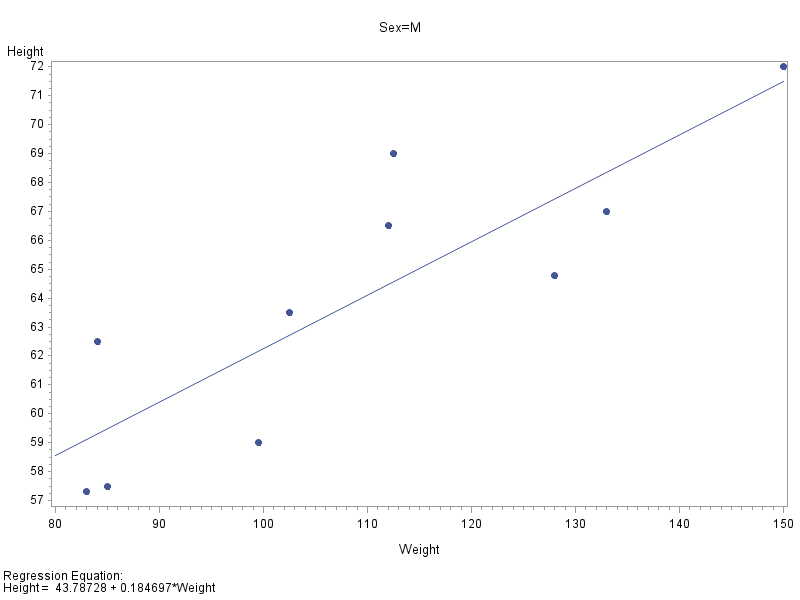
symbol1 value=dot interpol=rl;
proc gplot data=foo;
by sex;
plot height*weight / regeqn;
run;

- Mark as New
- Bookmark
- Subscribe
- Mute
- RSS Feed
- Permalink
- Report Inappropriate Content
GPLOT will, but I'm not sure about sgplot
- Mark as New
- Bookmark
- Subscribe
- Mute
- RSS Feed
- Permalink
- Report Inappropriate Content
Here's an example using gplot's "regeqn" option.
I'll have to let someone else answer whether sgplot has such an option.
proc sort data=sashelp.class out=foo;
by sex;
run;
symbol1 value=dot interpol=rl;
proc gplot data=foo;
by sex;
plot height*weight / regeqn;
run;

- Mark as New
- Bookmark
- Subscribe
- Mute
- RSS Feed
- Permalink
- Report Inappropriate Content
Since PROC REG calls SGRENDER in the background when you have ODS graphics on, I had hoped it would be easy to get the slope on the graph from PROC REG.
I tried with:
proc reg data=sashelp.class plots=FitPlot(stats=all);
  model height=weight;
  ods select FitPlot;
run;
And while it gives lots of statistics, slope isn't one of them.
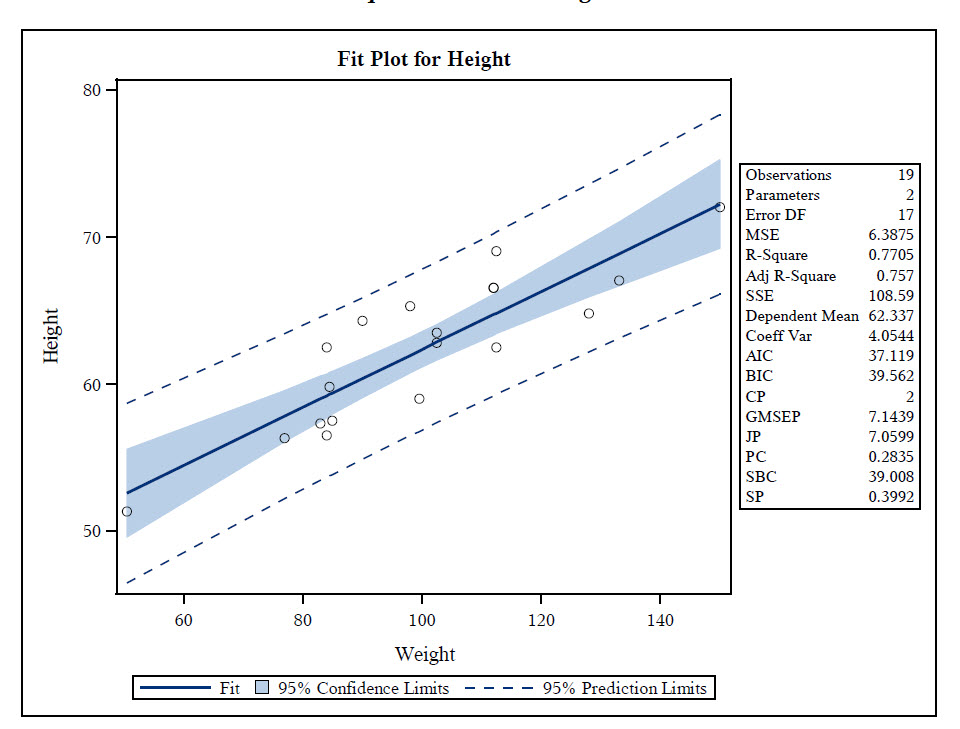
I suppose you might be able to get it from reg if you mucked about with Stat.REG.Graphics.Fit.
Register now at https://www.basug.org/events.
- Mark as New
- Bookmark
- Subscribe
- Mute
- RSS Feed
- Permalink
- Report Inappropriate Content
Thanks for all of your help and suggestions.
Since I already had all of my "proc sgplot" code written out, and since sgplot apparently does NOT have a way to generate the slope, I just did what I needed in a brute force manner as shown here:
For each plot of interest, I used proc sgplot to get my plot with confidence intervals:
title "Scatter Plot with Confidence Interval - PMC Non-Hispanics, Dx = Normal";
proc sgplot data=allpmc3;
where short_dx = "Normal";
reg y=mmsetotal x=frstotal / cli ;
yaxis values= (0 to 30 by 5);
xaxis values = (0 to 55 by 5);
run;
quit;
Then I did a Proc Rec using 'noprint', but with the OUTEST keyword to create a dataset containing the needed data:
proc reg data=allpmc3 noprint outest=PMC_norm;
where short_dx = "Normal";
model mmsetotal = frstotal;
run;
quit;
Then I modified the dataset created by OUTEST so that it provided the info in the format I needed:
data PMC_norm2;
set PMC_norm;
rename frstotal = slope;
group = "PMC Normal";
keep group intercept frstotal;
run;
Finally, once I had repeated the above steps for multiple plots and groupings, I just put all my datasets together so that I could print a nice neat table of intercepts and slopes:
data eq_params;
length group $12;
set metab_ad2 metab_mci2 metab_norm2
pmc_ad2 pmc_mci2 pmc_norm2;
run;
proc print data=eq_params;
run;

- Mark as New
- Bookmark
- Subscribe
- Mute
- RSS Feed
- Permalink
- Report Inappropriate Content
You can do the following:
(1) call PROC REG,
(2) create a macro variable with the parameter estimate (slope), and
(3) call PROC SGPLOT and use the INSET statement to put the slope on the graph. No need to modify any templates:
For an example, see SAS/STAT(R) 9.3 User's Guide
.jpg")
Catch up on SAS Innovate 2026
Nearly 200 sessions are now available on demand with the SAS Innovate Digital Pass.
Explore Now →Learn how use the CAT functions in SAS to join values from multiple variables into a single value.

Find more tutorials on the SAS Users YouTube channel.
SAS Training: Just a Click Away
Ready to level-up your skills? Choose your own adventure.
-
5 replies
-
02-22-2013 10:26 AM
-
6526 views
-
3 likes
-
5 in conversation
-
