- Home
- /
- Programming
- /
- Graphics
- /
- Re: Can Proc SGPlot generate the slope value of a regression line?
- RSS Feed
- Mark Topic as New
- Mark Topic as Read
- Float this Topic for Current User
- Bookmark
- Subscribe
- Mute
- Printer Friendly Page
- Mark as New
- Bookmark
- Subscribe
- Mute
- RSS Feed
- Permalink
- Report Inappropriate Content
I'm using proc sgplot with the reg option to generate a number of related plots. Is there a way to get proc sgplot to generate the slope of the regression line for me, so that I can compare the slopes of different plots? Or do I have to go run PROC REG? separately to have the system calculate the slope?
Accepted Solutions
- Mark as New
- Bookmark
- Subscribe
- Mute
- RSS Feed
- Permalink
- Report Inappropriate Content
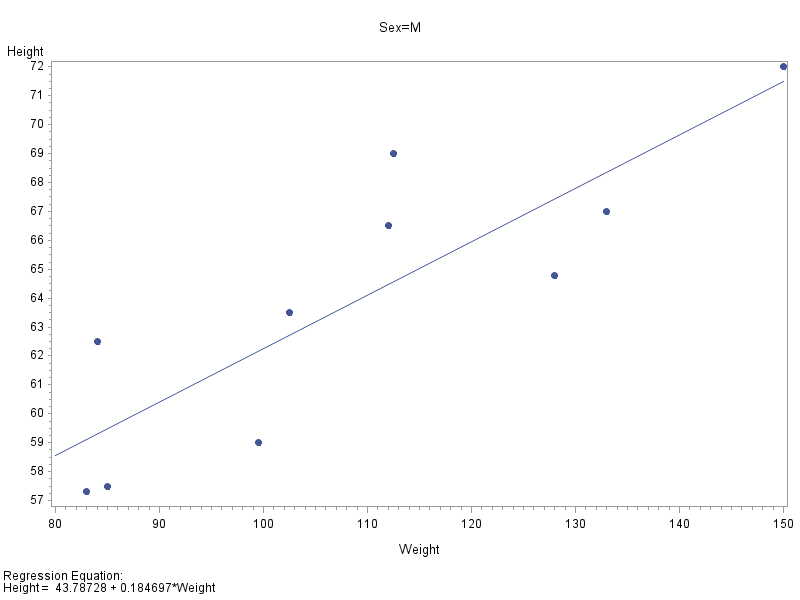
Here's an example using gplot's "regeqn" option.
I'll have to let someone else answer whether sgplot has such an option.
proc sort data=sashelp.class out=foo;
by sex;
run;
symbol1 value=dot interpol=rl;
proc gplot data=foo;
by sex;
plot height*weight / regeqn;
run;

- Mark as New
- Bookmark
- Subscribe
- Mute
- RSS Feed
- Permalink
- Report Inappropriate Content
GPLOT will, but I'm not sure about sgplot
- Mark as New
- Bookmark
- Subscribe
- Mute
- RSS Feed
- Permalink
- Report Inappropriate Content
Here's an example using gplot's "regeqn" option.
I'll have to let someone else answer whether sgplot has such an option.
proc sort data=sashelp.class out=foo;
by sex;
run;
symbol1 value=dot interpol=rl;
proc gplot data=foo;
by sex;
plot height*weight / regeqn;
run;

- Mark as New
- Bookmark
- Subscribe
- Mute
- RSS Feed
- Permalink
- Report Inappropriate Content
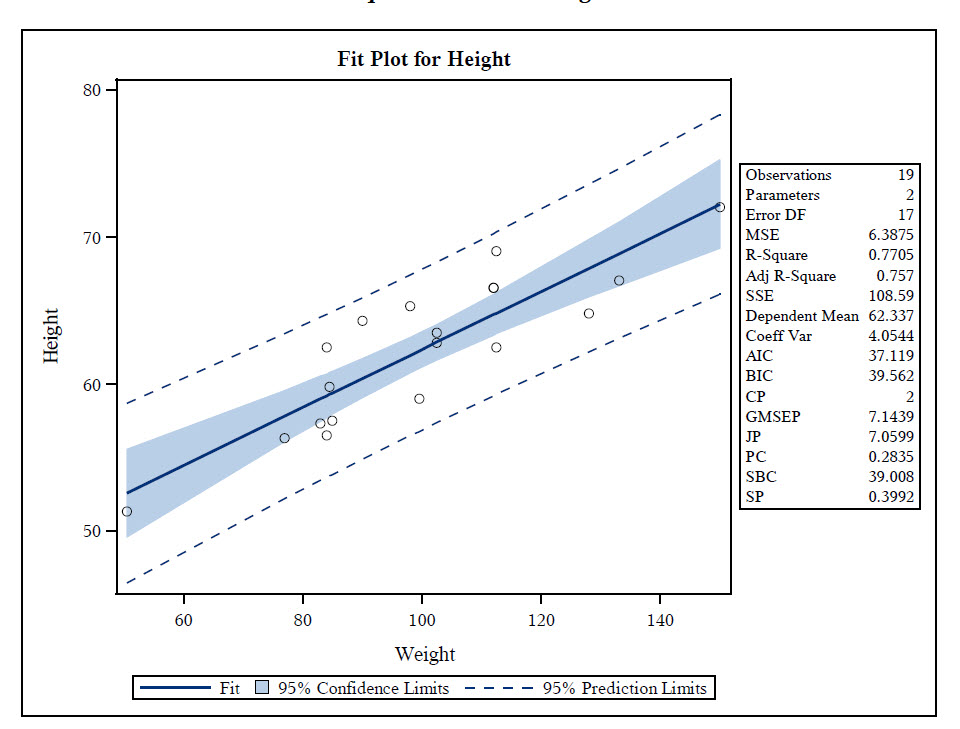
Since PROC REG calls SGRENDER in the background when you have ODS graphics on, I had hoped it would be easy to get the slope on the graph from PROC REG.
I tried with:
proc reg data=sashelp.class plots=FitPlot(stats=all);
  model height=weight;
  ods select FitPlot;
run;
And while it gives lots of statistics, slope isn't one of them.

I suppose you might be able to get it from reg if you mucked about with Stat.REG.Graphics.Fit.
- Mark as New
- Bookmark
- Subscribe
- Mute
- RSS Feed
- Permalink
- Report Inappropriate Content
Thanks for all of your help and suggestions.
Since I already had all of my "proc sgplot" code written out, and since sgplot apparently does NOT have a way to generate the slope, I just did what I needed in a brute force manner as shown here:
For each plot of interest, I used proc sgplot to get my plot with confidence intervals:
title "Scatter Plot with Confidence Interval - PMC Non-Hispanics, Dx = Normal";
proc sgplot data=allpmc3;
where short_dx = "Normal";
reg y=mmsetotal x=frstotal / cli ;
yaxis values= (0 to 30 by 5);
xaxis values = (0 to 55 by 5);
run;
quit;
Then I did a Proc Rec using 'noprint', but with the OUTEST keyword to create a dataset containing the needed data:
proc reg data=allpmc3 noprint outest=PMC_norm;
where short_dx = "Normal";
model mmsetotal = frstotal;
run;
quit;
Then I modified the dataset created by OUTEST so that it provided the info in the format I needed:
data PMC_norm2;
set PMC_norm;
rename frstotal = slope;
group = "PMC Normal";
keep group intercept frstotal;
run;
Finally, once I had repeated the above steps for multiple plots and groupings, I just put all my datasets together so that I could print a nice neat table of intercepts and slopes:
data eq_params;
length group $12;
set metab_ad2 metab_mci2 metab_norm2
pmc_ad2 pmc_mci2 pmc_norm2;
run;
proc print data=eq_params;
run;
- Mark as New
- Bookmark
- Subscribe
- Mute
- RSS Feed
- Permalink
- Report Inappropriate Content
You can do the following:
(1) call PROC REG,
(2) create a macro variable with the parameter estimate (slope), and
(3) call PROC SGPLOT and use the INSET statement to put the slope on the graph. No need to modify any templates:
For an example, see SAS/STAT(R) 9.3 User's Guide
April 27 – 30 | Gaylord Texan | Grapevine, Texas
Registration is open
Walk in ready to learn. Walk out ready to deliver. This is the data and AI conference you can't afford to miss.
Register now and lock in 2025 pricing—just $495!
Learn how use the CAT functions in SAS to join values from multiple variables into a single value.
Find more tutorials on the SAS Users YouTube channel.
SAS Training: Just a Click Away
Ready to level-up your skills? Choose your own adventure.


