- Home
- /
- Analytics
- /
- Stat Procs
- /
- Underestimate Fitting from PROC NLMIDED
- RSS Feed
- Mark Topic as New
- Mark Topic as Read
- Float this Topic for Current User
- Bookmark
- Subscribe
- Mute
- Printer Friendly Page

- Mark as New
- Bookmark
- Subscribe
- Mute
- RSS Feed
- Permalink
- Report Inappropriate Content
Hello,
Currently, I encountered one problem from Proc NLMIXED procedure. Any advice will be appreciated.
After I build random effect model by Proc NLMIXED, the event% from prediction is always lower than actual value. Here, I will use the example from "Fixed effects regression methods fro longitudinal data" (by Paul D. Allison) to describe my problem.
After run the code below, I got predicted Phat for both fixed and random effects and saved in data P2 and P respectively. Then I calculated the yearly event rate and compare them with actual value.
PROC
NLMIXED DATA=teenyrs5;
eta=b0 + byr1*(year=1)+ byr2*(year=2) + byr3*(year=3) +byr4*(year=4) + bmother*mother +bspouse*spouse +bschool*inschool + bhours*hours + alpha;
p=1/(1+ EXP(-eta));
MODEL pov~BINARY(p);
RANDOM alpha ~ NORMAL(0,s2) SUBJECT=id out=abc;
PARMS b0=-.29 byr1=-.06 byr2=.16 byr3=.09 byr4=.09 bmother=.99 bspouse=-1.26 bschool=.24 bhours=-.03 s2=1 ;
predict P out=p;
predict 1/(1+ EXP(-(b0 + byr1*(year=1)+ byr2*(year=2) + byr3*(year=3) +
byr4*(year= 4) + bmother*mother + bspouse*spouse +
bschool*inschool + bhours*hours))) out=p2;
RUN;
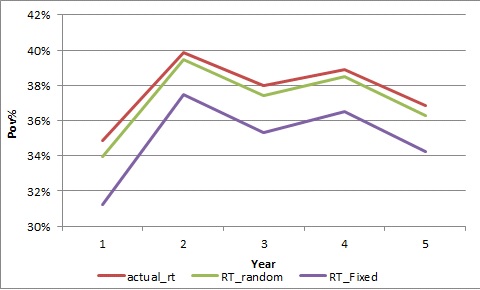
From both data and charts(attached picture), the predicted rates were lower than actual value with parallel shift.
| year | actual_rt | RT_random | RT_Fixed |
| 1 | 34.84% | 33.97% | 31.21% |
| 2 | 39.88% | 39.49% | 37.45% |
| 3 | 37.97% | 37.43% | 35.34% |
| 4 | 38.92% | 38.51% | 36.54% |
| 5 | 36.84% | 36.27% | 34.25% |
Since this is the first time I use Proc NLMIXED, I wonder if there is anything wrong in my process to predict yhat.Meanwhile, could I also setup the mean of alpha as random term instead of constant of 0.
Thanks a lot in advance.

- Mark as New
- Bookmark
- Subscribe
- Mute
- RSS Feed
- Permalink
- Report Inappropriate Content
It is hard to tell what is going on without the data. Also, you are apparently doing post-model-fit processing to get the numbers you are showing, and I can't tell what you are doing there. With more information, we might be able to help.
- Mark as New
- Bookmark
- Subscribe
- Mute
- RSS Feed
- Permalink
- Report Inappropriate Content
Hello Ivm,
Thank you so much for your reply. The data and code can be download from link below:
http://support.sas.com/downloads/package.htm?pid=1678
The data manipulation code is:
DATA
teenyrs5;
SET
my.teenpov;
ARRAY
pv(*) pov1-pov5;
ARRAY
mot(*) mother1-mother5;
ARRAY
spo(*) spouse1-spouse5;
ARRAY
ins(*) inschool1-inschool5;
ARRAY
hou(*) hours1-hours5;
DO
year=1 TO 5;
pov=pv(year);
mother=mot(year);
spouse=spo(year);
inschool=ins(year);
hours=hou(year);
OUTPUT
;
END
;
KEEP
id year black age pov mother spouse inschool hours;
RUN
;
Currently, I just guess if the nonlinear transformation between probability and odds by logit function is the main reason of my question. Because all observations under single id will be assigned identical random-intercept, but it will resulted in different impact on probability.
Thanks again and have a great weekend.
Weifeng

- Mark as New
- Bookmark
- Subscribe
- Mute
- RSS Feed
- Permalink
- Report Inappropriate Content
I believe you have identified a large part of the reason with "Meanwhile, could I also setup the mean of alpha as random term instead of constant of 0."
I guess my next question is why NLMIXED, rather than GLIMMIX. Wouldn't the following fit the same model?
proc glimmix data=teenyrs5 method=laplace;
class mother spouse inschool hours year id;
model pov= mother spouse inschool hours year/dist=binary solution;
random year/subject=id type=ar(1) g gcorr v vcorr; /* If you have sufficient data, you might want to try type=chol for an unstructured correlation matrix*/
run;
For predicted values, you can add an lsmeans statement. To estimate the fixed effects at various years, you will need to add interaction terms to the model statement (which may be the source of your difference in NLMIXED).
Steve Denham
.jpg")
Catch up on SAS Innovate 2026
Nearly 200 sessions are now available on demand with the SAS Innovate Digital Pass.
Explore Now →ANOVA, or Analysis Of Variance, is used to compare the averages or means of two or more populations to better understand how they differ. Watch this tutorial for more.

Find more tutorials on the SAS Users YouTube channel.
-
3 replies
-
12-04-2015 10:16 PM
-
2677 views
-
1 like
-
3 in conversation
-
