- Home
- /
- Analytics
- /
- Stat Procs
- /
- Re: Question about SAS paper
- RSS Feed
- Mark Topic as New
- Mark Topic as Read
- Float this Topic for Current User
- Bookmark
- Subscribe
- Mute
- Printer Friendly Page

- Mark as New
- Bookmark
- Subscribe
- Mute
- RSS Feed
- Permalink
- Report Inappropriate Content
Regarding this paper: http://support.sas.com/resources/papers/proceedings13/433-2013.pdf A multilevel model primer...
I have a question. On page 13 it says that based on the covariance parameter output on page 12, it seems that growth in reading achievement does vary between children. How would one approximate the % variability in this case (based on the covariance parameter output on page 12)?
I'll note that page 13 does say, "Although the magnitude of the intercept variance estimate is rarely interpreted in a substantive way, the pvalue for that variance parameter indicates that reading achievement at entry into kindergarten does vary between children."
Paper by: Bethany A. Bell, Mihaela Ene, Whitney Smiley, Jason A. Schoeneberger
I was told by SAS on YouTube to ask about this here. Thanks in advance.

- Mark as New
- Bookmark
- Subscribe
- Mute
- RSS Feed
- Permalink
- Report Inappropriate Content
Suppose you observe n data points, y(i) to y(n) that you want to explain with explanatory variables from X matrix, and variance of y is V. The "Covariance Parameter Estimates" table contains the estimates of the parameters in G and R, which, according to the Maximum Likelihood method (method = ml in code on p. 12), are in the following relationship with V:
l(G,R) 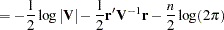 , where
Their values are labeled in the table along with Subject information. The estimates are displayed in the Estimate column.
References
[1] Covariance Parameter Estimates table
- Mark as New
- Bookmark
- Subscribe
- Mute
- RSS Feed
- Permalink
- Report Inappropriate Content
Thanks, pink poodle, but this doesn't help with inference. At least, it doesn't help me.
- Mark as New
- Bookmark
- Subscribe
- Mute
- RSS Feed
- Permalink
- Report Inappropriate Content
On page 7 they are calculating % variability using ICC. That might work here, too.
- Mark as New
- Bookmark
- Subscribe
- Mute
- RSS Feed
- Permalink
- Report Inappropriate Content
Thanks pink poodle. I was wondering about that. Do you know for sure if it would be appropriate to do that? If so, that would be great, very straightforward.
- Mark as New
- Bookmark
- Subscribe
- Mute
- RSS Feed
- Permalink
- Report Inappropriate Content
From looking at their Table 4 on page 14, they are calculating ICC for the intercept of timemos model 1 on page 12. There is an asterisk at the bottom of the table that says it's equal to 0.19, which makes their results statistically significant.
.jpg")
Catch up on SAS Innovate 2026
Nearly 200 sessions are now available on demand with the SAS Innovate Digital Pass.
Explore Now →ANOVA, or Analysis Of Variance, is used to compare the averages or means of two or more populations to better understand how they differ. Watch this tutorial for more.

Find more tutorials on the SAS Users YouTube channel.
-
5 replies
-
10-15-2018 09:11 AM
-
3957 views
-
2 likes
-
2 in conversation
-
