- Home
- /
- Analytics
- /
- Stat Procs
- /
- Re: Proc Lifetest - Number at Risk Vs Number Left
- RSS Feed
- Mark Topic as New
- Mark Topic as Read
- Float this Topic for Current User
- Bookmark
- Subscribe
- Mute
- Printer Friendly Page

- Mark as New
- Bookmark
- Subscribe
- Mute
- RSS Feed
- Permalink
- Report Inappropriate Content
Hello,
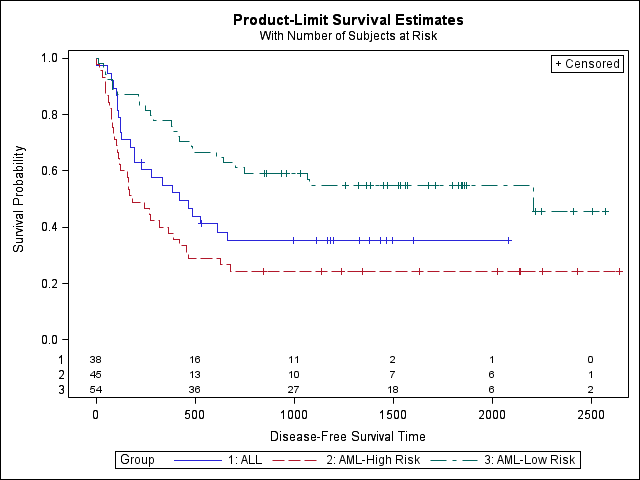
Do you know why the atrisk numbers are different on a survival curve compared to the atrisk numbers that are in the ods ProductLimitEstimates dataset in the NumberAtRisk column? It seems like the atrisk numbers on the survival curve correspond to the Left column (Number Left) in the ods ProductLimitEstimates dataset? Can you help please?
Many thanks,
Kriss Harris ![]()
Accepted Solutions

- Mark as New
- Bookmark
- Subscribe
- Mute
- RSS Feed
- Permalink
- Report Inappropriate Content
You can generate the source code for the graph and see it references the ATRISK, check the log...
ods trace on;
ods output ProductLimitEstimates = surv;
proc lifetest data=sashelp.BMT plots=survival(atrisk=0 to 2500 by 500) atrisk timelist = 0 to 2500 by 500;
time T * Status(0);
strata Group / test=logrank adjust=sidak;
run;
ods trace off;
proc template;
source Stat.Lifetest.Graphics.ProductLimitSurvival;
run;quit;
- Mark as New
- Bookmark
- Subscribe
- Mute
- RSS Feed
- Permalink
- Report Inappropriate Content
Can you post some sample data with this issue?
- Mark as New
- Bookmark
- Subscribe
- Mute
- RSS Feed
- Permalink
- Report Inappropriate Content
Okay, I will create some. Thanks.
- Mark as New
- Bookmark
- Subscribe
- Mute
- RSS Feed
- Permalink
- Report Inappropriate Content
Hi Reeza,
Here is the sample code:
ods output ProductLimitEstimates = out.surv;
proc lifetest data=sashelp.BMT plots=survival(atrisk=0 to 2500 by 500) atrisk timelist = 0 to 2500 by 500;
time T * Status(0);
strata Group / test=logrank adjust=sidak;
run;
I can't attach the dataset at the moment, but you will see what I mean when you run the program and compare the Left Column with the NumberAtRisk column and then also compare them to the graph.
Thanks.
- Mark as New
- Bookmark
- Subscribe
- Mute
- RSS Feed
- Permalink
- Report Inappropriate Content
For the code I ran, number at risk=number left because there are no ties or multiple occurrences with censors at the same time in this data.
The number left = number at risk seems to make sense intuitively to me except possibly when a censored and event occur at the same time?
- Mark as New
- Bookmark
- Subscribe
- Mute
- RSS Feed
- Permalink
- Report Inappropriate Content
Okay thank you. Do you know which Atrisk values we should be using please when there are differences between number at risk and number left?
- Mark as New
- Bookmark
- Subscribe
- Mute
- RSS Feed
- Permalink
- Report Inappropriate Content
You can generate the source code for the graph and see it references the ATRISK, check the log...
ods trace on;
ods output ProductLimitEstimates = surv;
proc lifetest data=sashelp.BMT plots=survival(atrisk=0 to 2500 by 500) atrisk timelist = 0 to 2500 by 500;
time T * Status(0);
strata Group / test=logrank adjust=sidak;
run;
ods trace off;
proc template;
source Stat.Lifetest.Graphics.ProductLimitSurvival;
run;quit;
- Mark as New
- Bookmark
- Subscribe
- Mute
- RSS Feed
- Permalink
- Report Inappropriate Content
Thank you for this Reeza, I'll check.
- Mark as New
- Bookmark
- Subscribe
- Mute
- RSS Feed
- Permalink
- Report Inappropriate Content
Hi Reeza,
Thank you for helping out with this. I've just gone back to it, and I can see that the template does reference the ATRISK number. I wonder why the plot uses the Left column then?
- Mark as New
- Bookmark
- Subscribe
- Mute
- RSS Feed
- Permalink
- Report Inappropriate Content
From reading Jack Shostak's book, I've seen that a solution to the question mentioned above is to output the "survivalplot" dataset.
.jpg")
Catch up on SAS Innovate 2026
Nearly 200 sessions are now available on demand with the SAS Innovate Digital Pass.
Explore Now →ANOVA, or Analysis Of Variance, is used to compare the averages or means of two or more populations to better understand how they differ. Watch this tutorial for more.

Find more tutorials on the SAS Users YouTube channel.
-
9 replies
-
11-12-2014 10:41 AM
-
18232 views
-
4 likes
-
2 in conversation
-
