- Home
- /
- Analytics
- /
- Stat Procs
- /
- Proc FREQ : How to get the sign of stratum-adjusted Spearman correlati...
- RSS Feed
- Mark Topic as New
- Mark Topic as Read
- Float this Topic for Current User
- Bookmark
- Subscribe
- Mute
- Printer Friendly Page

- Mark as New
- Bookmark
- Subscribe
- Mute
- RSS Feed
- Permalink
- Report Inappropriate Content
Hello,
The CMH statistic calculated on RIDIT scores (proc FREQ) takes the value (n-1)*Rs**2 where Rs is the Spearman rank correlation. This is of interest with multi-level tables, because it is the only way in SAS to get a stratum-adjusted Spearman correlation. How can I get the sign of Rs?
PG

- Mark as New
- Bookmark
- Subscribe
- Mute
- RSS Feed
- Permalink
- Report Inappropriate Content
You can get Spearmen coefficients from PROC CORR with the SPEARMAN option. For example, the Spearman coefficient for the following data is 0.36332 and n=21. The CMH statistic is (21-1)*(0.36332)**2 = 2.6400
data test;
call streaminit(1);
do i = 1 to 21;
x = rand("table", 0.5, 0.3, 0.2);
y = rand("table", 0.5-x/10, 0.3, 0.2+x/10);
output;
end;
run;
proc corr data=test spearman noprob;
var x y;
run;
proc freq data=test;
tables x*y / scores=ridit cmh norow nopercent nocol;
run;
- Mark as New
- Bookmark
- Subscribe
- Mute
- RSS Feed
- Permalink
- Report Inappropriate Content
Thanks. But my question is about stratum-adjusted correlations. As with TABLES A*x*y / ...
PG

- Mark as New
- Bookmark
- Subscribe
- Mute
- RSS Feed
- Permalink
- Report Inappropriate Content
Proc corr;
by A;
I would think would do it.
- Mark as New
- Bookmark
- Subscribe
- Mute
- RSS Feed
- Permalink
- Report Inappropriate Content
In proc freq, strata play a distinct role from BY analysis. A stratum-adjusted correlation is not the same as correlations by stratum. The former is a single coefficient of within strata relationship, the later are multiple coefficients, one for each stratum. - PG

- Mark as New
- Bookmark
- Subscribe
- Mute
- RSS Feed
- Permalink
- Report Inappropriate Content
What about dummy coding the strata variable, then using proc corr and putting all the dummy variables in the partial statement? (I haven't checked the validity of this approach.)

- Mark as New
- Bookmark
- Subscribe
- Mute
- RSS Feed
- Permalink
- Report Inappropriate Content
Hmm, that sounds logical to me--partialling out the strata effect ought to at least get the sign correct.
Steve Denham
- Mark as New
- Bookmark
- Subscribe
- Mute
- RSS Feed
- Permalink
- Report Inappropriate Content
Back at this, at last. The partial correlation sounded indeed like an intuitively appealing idea, thanks . So I ran a simulation. Correlated random pairs were generated with proc simnormal. Data was divided into 5 groups with means 1, 2, 3, 5, 7 and Std devs 1, 2, 3, 5, 7, each group represented by 100 pairs. The exercise was repeated for correlations of 0.5 and -0.1. Partial and stratum-adjusted correlation estimates were compared for 1000 sets of 500 observations. Stratum-adjusted estimates were given the sign of the corresponding partial correlation as suggested by . Here are the results:
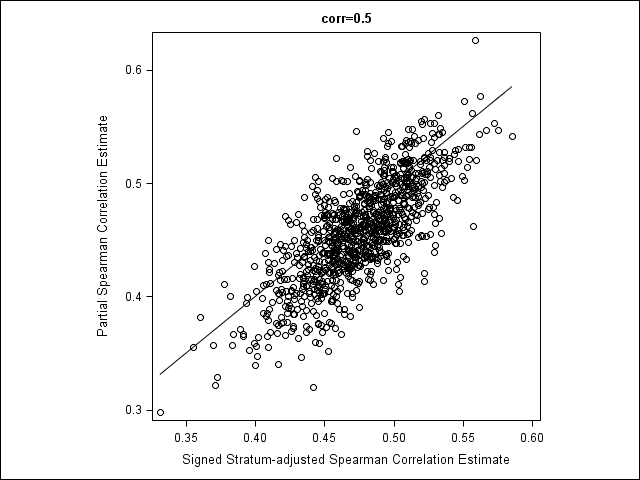
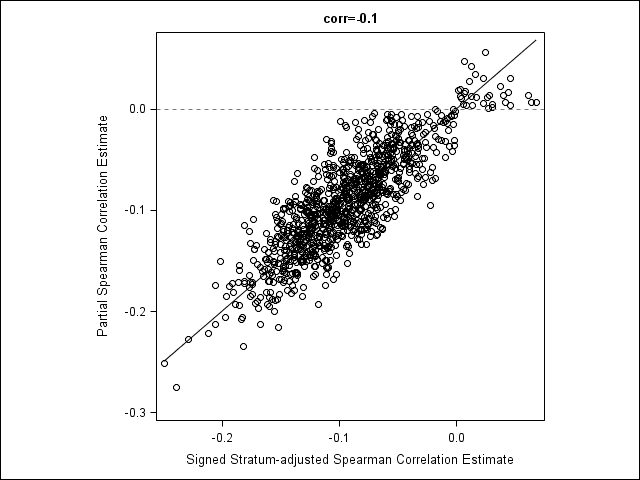
It is obvious to me that the two estimates are somewhat related and sligntly biassed toward zero, but certainly not equivalent. In the small negative correlation simulation, about 1% of the stratum-adjusted correlations were given the wrong sign.
PG
.jpg")
Catch up on SAS Innovate 2026
Nearly 200 sessions are now available on demand in the Innovate Hub.
Watch Now →ANOVA, or Analysis Of Variance, is used to compare the averages or means of two or more populations to better understand how they differ. Watch this tutorial for more.

Find more tutorials on the SAS Users YouTube channel.
-
7 replies
-
05-28-2015 12:21 PM
-
5059 views
-
7 likes
-
5 in conversation
-
