- Home
- /
- Analytics
- /
- Stat Procs
- /
- Logistic Regression Categorization
- RSS Feed
- Mark Topic as New
- Mark Topic as Read
- Float this Topic for Current User
- Bookmark
- Subscribe
- Mute
- Printer Friendly Page
- Mark as New
- Bookmark
- Subscribe
- Mute
- RSS Feed
- Permalink
- Report Inappropriate Content
Why is that when I categorize a variable in logistic regression by making it binary at the 75th percentile cutoff, it makes Variable 2 which was previously significant into non-significant. Then, when I change the categorization to binary while using an outlier number much greater than the 75th percentile as the cut off , Variable 2 then becomes significant again?
For example
1) model event1= variable 1(continuous), variable 2(categorical)
- variable 1 is significant, variable 2 is significant
2) model event1= variable 1 (categorical at 75th percentile), variable 2(categorical)
- variable 1 is significant, variable 2 becomes non-significant
3) model event1= variable1 (categorical at outlier point, much greater than 75th percentile), variable 2(categorical)
- variable 1 is significant, variable 2 is again significant
Accepted Solutions
- Mark as New
- Bookmark
- Subscribe
- Mute
- RSS Feed
- Permalink
- Report Inappropriate Content
You changed a variable and the model changed?
That’s to be expected. THis is almost a good example of why it’s not a good idea to categorize data.
Categorizing a continuous variable suddenly means that 10 and 11 can be entirely separate categories where the weren’t previously.
I would do some cross tabs (Variable1*outcome) and variable2*outcome to see what happens with the outcome. Knowing your data will help to understand why this is happening.
- Mark as New
- Bookmark
- Subscribe
- Mute
- RSS Feed
- Permalink
- Report Inappropriate Content
Hello @sasnewbie12,
Your question requires more details before experts can help. Can you revise your question to include more information?
Review this checklist:
- Specify a meaningful subject line for your topic. Avoid generic subjects like "need help," "SAS query," or "urgent."
- When appropriate, provide sample data in text or DATA step format. See this article for one method you can use.
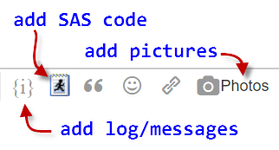
- If you're encountering an error in SAS, include the SAS log or a screenshot of the error condition. Use the Photos button to include the image in your message.
- It also helps to include an example (table or picture) of the result that you're trying to achieve.
To edit your original message, select the "blue gear" icon at the top of the message and select Edit Message. From there you can adjust the title and add more details to the body of the message. Or, simply reply to this message with any additional information you can supply.
SAS experts are eager to help -- help them by providing as much detail as you can.
This prewritten response was triggered for you by fellow SAS Support Communities member @ballardw
.- Mark as New
- Bookmark
- Subscribe
- Mute
- RSS Feed
- Permalink
- Report Inappropriate Content
Code would tell us which options might have an effect.
You also might provide examples of the two sets. It may be interesting to see how you accomplish "making it binary at the 7th percentile cutoff".
But it sounds like you are surprised that you change the data or the model and get different results. That is generally not uncommon.
- Mark as New
- Bookmark
- Subscribe
- Mute
- RSS Feed
- Permalink
- Report Inappropriate Content
You changed a variable and the model changed?
That’s to be expected. THis is almost a good example of why it’s not a good idea to categorize data.
Categorizing a continuous variable suddenly means that 10 and 11 can be entirely separate categories where the weren’t previously.
I would do some cross tabs (Variable1*outcome) and variable2*outcome to see what happens with the outcome. Knowing your data will help to understand why this is happening.
ANOVA, or Analysis Of Variance, is used to compare the averages or means of two or more populations to better understand how they differ. Watch this tutorial for more.
Find more tutorials on the SAS Users YouTube channel.


