- Home
- /
- SAS Viya
- /
- Visual Analytics
- /
- Re: Simple Excel chart not able to develop in SAS Visual Analytics
- RSS Feed
- Mark Topic as New
- Mark Topic as Read
- Float this Topic for Current User
- Bookmark
- Subscribe
- Mute
- Printer Friendly Page
- Mark as New
- Bookmark
- Subscribe
- Mute
- RSS Feed
- Permalink
- Report Inappropriate Content
Hi Everybody
I am trying to create a simple Excel Bar chart in SAS Visual Analytics. I have to make year on year comparison for the values of different kinds of measures in a bar graph.
I have attached the excel graph with the data.
It may be very simple but its urgent.
Kind Regards
Soumya Sen
- Mark as New
- Bookmark
- Subscribe
- Mute
- RSS Feed
- Permalink
- Report Inappropriate Content
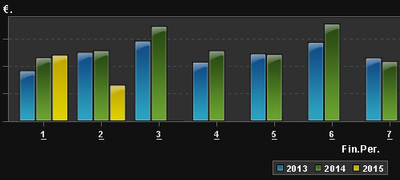
For convenience, here is the graph from Soumya's spreadsheet:
The bar chart has 3 measures, a group variable, but no category variable.
Anyone have a suggestion of how this can be created in VA?
Thanks,
Sam
- Mark as New
- Bookmark
- Subscribe
- Mute
- RSS Feed
- Permalink
- Report Inappropriate Content
Hi Soumya,
Its possible while making a new calculated field per year. I did cut off the left axis...
Use the following code per year (F.Year in our case)
IF ( 'F.Year.'n = Year(DatePart(Now())) )
RETURN 'Sal.Val.€.'n
ELSE 0
And this one for the last year.
IF ( 'F.Year.'n = ( Year(DatePart(Now())) - 1 ) )
RETURN 'Sal.Val.€.'n
ELSE 0
Drag both variables into the bargraph and magic happens....
Greetings Peter
- Mark as New
- Bookmark
- Subscribe
- Mute
- RSS Feed
- Permalink
- Report Inappropriate Content
I have developed the following variables:
My variable is named ‘Year’ so used Year('Year'n): so dint get confused on that.
- For measure variable loss and for 2015 I have created a new variable called FY2015_loss
IF ( Year('Year'n) = ( Year(DatePart(Now())) - 1 ) )
RETURN 'loss'n
ELSE 0
- For measure variable loss and for 2016 I have created a new variable called FY2015_loss
IF ( Year('Year'n) = Year(DatePart(Now())) )
RETURN 'loss'n
ELSE 0
- For measure variable revenue and for 2015 I have created a new variable called FY2015_revenue
IF ( Year('Year'n) = Year(DatePart(Now())) )
RETURN 'loss'n
ELSE 0
- For measure variable revenue and for 2016 I have created a new variable called FY2016_revenue
IF ( Year('Year'n) = Year(DatePart(Now())) )
RETURN 'loss'n
ELSE 0
But when I am assigning the variables the visual is not getting generated.
Please find attached in the last page what is the error.
- Mark as New
- Bookmark
- Subscribe
- Mute
- RSS Feed
- Permalink
- Report Inappropriate Content
Also one thing how did you cut the left axis
- Mark as New
- Bookmark
- Subscribe
- Mute
- RSS Feed
- Permalink
- Report Inappropriate Content
Not that VA could do this .
Greetings
- Mark as New
- Bookmark
- Subscribe
- Mute
- RSS Feed
- Permalink
- Report Inappropriate Content
You have not used a category yet, and you must use it to have the bars to show.
Thats what i see in your screen print, the rest seems to be ok.
Greetings
- Mark as New
- Bookmark
- Subscribe
- Mute
- RSS Feed
- Permalink
- Report Inappropriate Content
Thanks but in the excel we are not using any category .
- Mark as New
- Bookmark
- Subscribe
- Mute
- RSS Feed
- Permalink
- Report Inappropriate Content
I am very confused now.
Your categories are Expence, Debt and CostOfDebt.....
Greetings
- Mark as New
- Bookmark
- Subscribe
- Mute
- RSS Feed
- Permalink
- Report Inappropriate Content
But Thanks a lot.
Using a category I can arrive at that.
- Mark as New
- Bookmark
- Subscribe
- Mute
- RSS Feed
- Permalink
- Report Inappropriate Content
One thing . My Measure values are under Expense, Debt . They are not categories /neither they appear under category list in SAS VA
- Mark as New
- Bookmark
- Subscribe
- Mute
- RSS Feed
- Permalink
- Report Inappropriate Content
Sorry to confuse you.
In my excel sheet you will find Year as my category.
And Expense ,Debt and Cost of Debt as the measure variables. So they dont appear under the category list.
Kind Regards
Soumya Sen
See how to use one filter for multiple data sources by mapping your data from SAS’ Alexandria McCall.
Find more tutorials on the SAS Users YouTube channel.


