- Home
- /
- SAS Viya
- /
- Visual Analytics
- /
- Missing categories in bar chart
- RSS Feed
- Mark Topic as New
- Mark Topic as Read
- Float this Topic for Current User
- Bookmark
- Subscribe
- Mute
- Printer Friendly Page
- Mark as New
- Bookmark
- Subscribe
- Mute
- RSS Feed
- Permalink
- Report Inappropriate Content
Hi all,
It's my first time in the forum so I hope this question hasn't been posted before.
My problem with SAS VA is that when using a bar chart, some of my groups don't have values in every category. Thus in these categories, there is no bar shown. is there a way to show a "zero" bar or at least a missing space where that bar should normally be? here is an example:

Accepted Solutions
- Mark as New
- Bookmark
- Subscribe
- Mute
- RSS Feed
- Permalink
- Report Inappropriate Content
Well, I can't help with VA specifics, however code wise its pretty straight forward, just create a template of your categories, and then merge that with the data you have. If you need specifics per parts of your data then proc sort distinct your data for the values you want, add a do loop to assign the categories, then merge back.
- Mark as New
- Bookmark
- Subscribe
- Mute
- RSS Feed
- Permalink
- Report Inappropriate Content
Well, first thing that comes to my mind, just add a row in your data for each missing category, with a result of 0, then all the categories will appear.
- Mark as New
- Bookmark
- Subscribe
- Mute
- RSS Feed
- Permalink
- Report Inappropriate Content
yes that would be possible, but I would need to think about every possible combination of categories and also filters that may appear which makes this really hard. I was hoping for an easier solution directly in VA...
- Mark as New
- Bookmark
- Subscribe
- Mute
- RSS Feed
- Permalink
- Report Inappropriate Content
Well, I can't help with VA specifics, however code wise its pretty straight forward, just create a template of your categories, and then merge that with the data you have. If you need specifics per parts of your data then proc sort distinct your data for the values you want, add a do loop to assign the categories, then merge back.
- Mark as New
- Bookmark
- Subscribe
- Mute
- RSS Feed
- Permalink
- Report Inappropriate Content
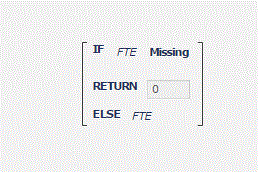
You may be able to use a calculated query with the missing function to force VA to output a value.
Something like
- Mark as New
- Bookmark
- Subscribe
- Mute
- RSS Feed
- Permalink
- Report Inappropriate Content
I have tried this, but the bar and label is still missing from the bar graph. Not sure if this is because it's a zero value or if report designer doesn't recognize the value resulting from Boolean transformations (I get the concept but don't know the proper terms!). Has anyone managed to force the graph to display the label?
- Mark as New
- Bookmark
- Subscribe
- Mute
- RSS Feed
- Permalink
- Report Inappropriate Content
what happens if you try 0.000001 instead of 0 (just as a test)
- Mark as New
- Bookmark
- Subscribe
- Mute
- RSS Feed
- Permalink
- Report Inappropriate Content
Thanks for the suggestion. I had tried this with 0.1 and it still didn't work. Will keep experimenting.
- Mark as New
- Bookmark
- Subscribe
- Mute
- RSS Feed
- Permalink
- Report Inappropriate Content
Hello,
Any solution within VA for this yet? I am running into the same issue with a crosstab.
Thank you!
- Mark as New
- Bookmark
- Subscribe
- Mute
- RSS Feed
- Permalink
- Report Inappropriate Content
Visual Analytics cannot show a row that does not exist in the data source. In this example, there is no Status for TaskA for Jan 12 and Feb 12 but those rows do exist in the data source with missing values. If rows 4 and 5 did not exist at all, Visual Analytics could not insert them.
This is what the table looks like with missing values in rows 4 and 5. If rows 4 and 5 did not exist, then TaskA would show only one row: Success.
-------------------------------------------------------------------------
Four tips to remember when you contact SAS Technical Support
Tricks for SAS Visual Analytics Report Builders
SAS Visual Analytics Learning Center
See how to use one filter for multiple data sources by mapping your data from SAS’ Alexandria McCall.
Find more tutorials on the SAS Users YouTube channel.


