- Home
- /
- SAS Viya
- /
- Visual Analytics
- /
- Re: Methods to the March Madness: Visual Analytics
- RSS Feed
- Mark Topic as New
- Mark Topic as Read
- Float this Topic for Current User
- Bookmark
- Subscribe
- Mute
- Printer Friendly Page

- Mark as New
- Bookmark
- Subscribe
- Mute
- RSS Feed
- Permalink
- Report Inappropriate Content
The NCAA Tournament and its "March Madness" are now upon us - but before the games begin there is this stress for many teams about whether they will make the final four. Using Big Data concepts and SAS Visual analytics, we were able to create a predictive model in SAS Visual Analytics. To complete this task, we opted to use a SAS VA Geo Map.
Have you used a Geo Map in VA yet? It’s easy to create one! We created the charts below by taking these few simple steps:
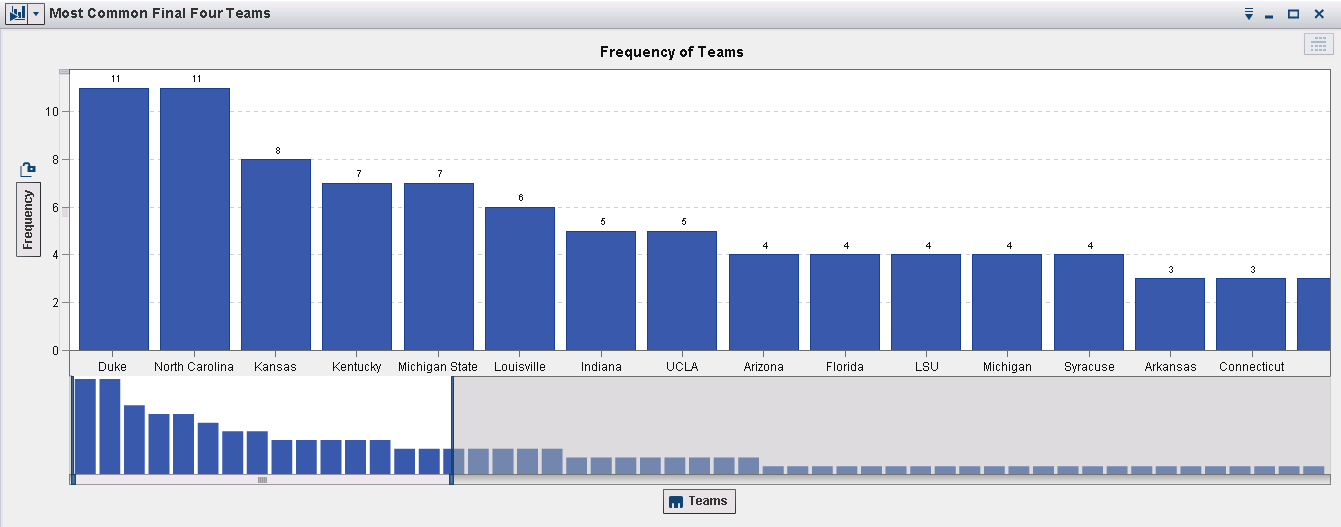
1. We made a SAS data set containing the names of all the teams in the final four since 1979.
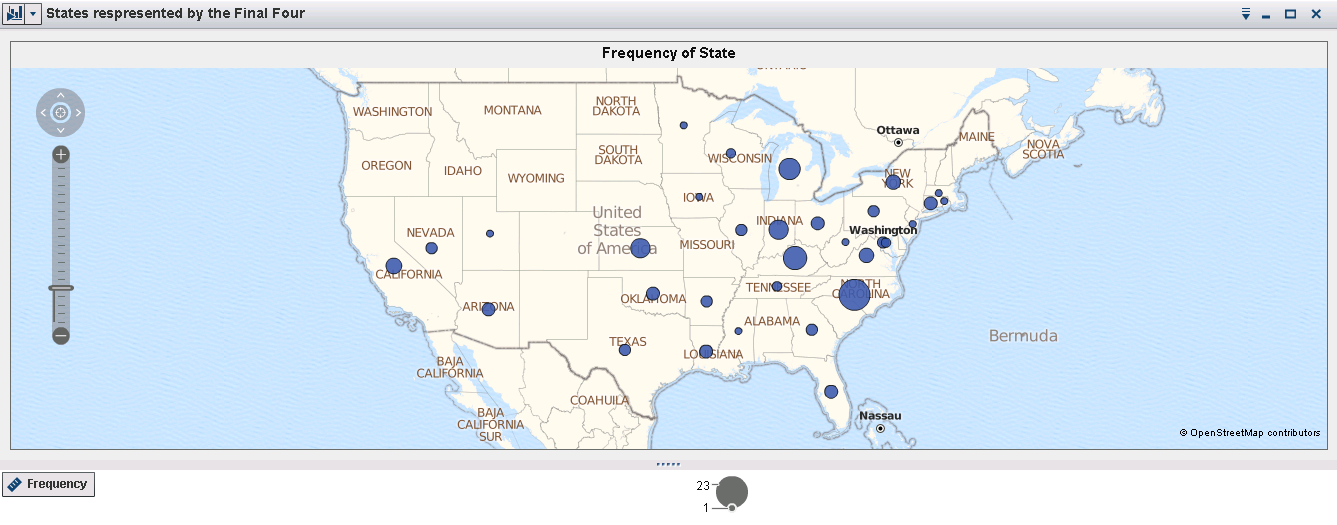
2. We then added US state abbreviations for each team to the list to create the geo map.
3. We dragged over both final four team names and the state codes to the workspace in VA to create the attached graphs.
Also, we took other basketball data into account. Here are some other helpful (and some not-so-helpful) factors for selection. Here’s what’s been successful in the past:
• RPI (Rating Percentage Index), based upon wins, losses, and strength of schedule
• Jeff Sagarin rankings from USA Today
• Wins against top 25 teams (per RPI rankings)
• Wins against teams ranked 26-50
• Neutral court wins (Note: conference tournaments matter!)
• Record and rank in-conference (regular season championships matter!)
• Strength of conference (conferences do matter!)
Based on the historical data and the current basketball factors/trends, this is our final four prediction: Duke, Carolina, Kansas, and Kentucky. Now it’s your turn! Let's submit a community bracket to prove that SAS has the best modelers around! Please submit your entries to this thread during the tournament. Entries can be submitted prior to the start of the NCAA tournament or during the tournament. Having a hard time viewing the charts on your browser? Please see the attached .pdfs for an example. Thanks!
Most Common Final Four Teams
States Represented by the Final Four:


- Mark as New
- Bookmark
- Subscribe
- Mute
- RSS Feed
- Permalink
- Report Inappropriate Content
No #1 seeds in the final four AND no teams from the Big 10? And here I had heard so much about the utility and power of VA.
And, two teams from N.C? Sure sounds like bias has influenced your modelling.
- Mark as New
- Bookmark
- Subscribe
- Mute
- RSS Feed
- Permalink
- Report Inappropriate Content
OK. It's SAS VA vs. Excel.
My picks, with Excel, have the following final four: Kansas, Michigan State., Michigan and Wisconsin
Winner: Michigan State
and, yes, my Excel algorithm is also biased ![]()
.jpg")
Catch up on SAS Innovate 2026
Nearly 200 sessions are now available on demand with the SAS Innovate Digital Pass.
Explore Now →See how to use one filter for multiple data sources by mapping your data from SAS’ Alexandria McCall.

Find more tutorials on the SAS Users YouTube channel.
-
2 replies
-
03-17-2014 03:05 PM
-
2974 views
-
2 likes
-
2 in conversation
-
