- Home
- /
- SAS Viya
- /
- Visual Analytics
- /
- Re: MAP & route
- RSS Feed
- Mark Topic as New
- Mark Topic as Read
- Float this Topic for Current User
- Bookmark
- Subscribe
- Mute
- Printer Friendly Page


- Mark as New
- Bookmark
- Subscribe
- Mute
- RSS Feed
- Permalink
- Report Inappropriate Content
HI,
Accepted Solutions


- Mark as New
- Bookmark
- Subscribe
- Mute
- RSS Feed
- Permalink
- Report Inappropriate Content
Yes, that is correct! For your use case, you will want to use the Geo Line object, which takes polyline data as its input.
To make this work, you need to configure your geo data item to use a custom geo data provider linked to your polyline data. You can find detailed instructions on configuring a geo provider in the SAS documentation, but if you get stuck, just reply here and we’ll be happy to help!
Here is the high-level process:
-
Upload your data: Load your polyline data into a shared CAS library in SAS Viya.
-
Create a new provider: Open Visual Analytics (VA) and configure your geo data item. Change its type to "Geographical data provider" and create a new provider. (Note: You need admin privileges to do this).
-
Map your IDs: Select your uploaded data table and ensure the selected ID column matches the values in your geo data item. Each unique ID (e.g.,
route_1,route_2) represents a series of data points that make up your route. Because of this, your report's main data source only needs to contain the actual ID values. -
Assign the visual: Once your custom data provider is created, apply it to your geo data item and verify the corresponding ID column is selected. Finally, assign that data item to the Geo Line object in your report.
Hope this helps!
Falko


- Mark as New
- Bookmark
- Subscribe
- Mute
- RSS Feed
- Permalink
- Report Inappropriate Content
Create a GeoMap with nodes and lines
https://communities.sas.com/t5/SAS-Visual-Analytics/Create-a-GeoMap-with-nodes-and-lines/td-p/391449
Geographical visualizations in SAS Visual Analytics
( see the section at the bottom named "Routing, drivetime and geographic area" )
BR,
Koen
- Mark as New
- Bookmark
- Subscribe
- Mute
- RSS Feed
- Permalink
- Report Inappropriate Content
Hi Koen, thanks for this answer. It confirms that it's possible but I don't really have the solution to do it. I think that the solution is the polyline. But how to create a polyline
- Mark as New
- Bookmark
- Subscribe
- Mute
- RSS Feed
- Permalink
- Report Inappropriate Content
Maybe you find it here:
- Create geo-line geography roles
https://communities.sas.com/t5/SAS-Visual-Analytics/Create-geo-line-geography-roles/td-p/866733 - SAS Help Center: Working with Geo Maps (Geographic Objects)
In the bottom you find:

Otherwise @FalkoSchulz and/or @GregTreiman can help you out.
Ciao,
Koen
- Mark as New
- Bookmark
- Subscribe
- Mute
- RSS Feed
- Permalink
- Report Inappropriate Content
Yes, that is correct! For your use case, you will want to use the Geo Line object, which takes polyline data as its input.
To make this work, you need to configure your geo data item to use a custom geo data provider linked to your polyline data. You can find detailed instructions on configuring a geo provider in the SAS documentation, but if you get stuck, just reply here and we’ll be happy to help!
Here is the high-level process:
-
Upload your data: Load your polyline data into a shared CAS library in SAS Viya.
-
Create a new provider: Open Visual Analytics (VA) and configure your geo data item. Change its type to "Geographical data provider" and create a new provider. (Note: You need admin privileges to do this).
-
Map your IDs: Select your uploaded data table and ensure the selected ID column matches the values in your geo data item. Each unique ID (e.g.,
route_1,route_2) represents a series of data points that make up your route. Because of this, your report's main data source only needs to contain the actual ID values. -
Assign the visual: Once your custom data provider is created, apply it to your geo data item and verify the corresponding ID column is selected. Finally, assign that data item to the Geo Line object in your report.
Hope this helps!
Falko
- Mark as New
- Bookmark
- Subscribe
- Mute
- RSS Feed
- Permalink
- Report Inappropriate Content
Wonderful !!!
Thanks a lot. On last question.
I choose Polyline. Based on my route base
ID column : In my dataset. It's Tournee_ID. A unique ID far all points. Right?
Segment Column : it's what you say. I must have a unique ID for each point of my route
And after, it's X and Y
If you can confirm it


- Mark as New
- Bookmark
- Subscribe
- Mute
- RSS Feed
- Permalink
- Report Inappropriate Content
- Mark as New
- Bookmark
- Subscribe
- Mute
- RSS Feed
- Permalink
- Report Inappropriate Content
I forgot to add @FalkoSchulz 😀
- Mark as New
- Bookmark
- Subscribe
- Mute
- RSS Feed
- Permalink
- Report Inappropriate Content
Yes, that looks good!
To clarify the setup:
-
ID Column: This will be your
Num tourneecolumn. -
Segment Column: This is optional for polylines. It is only required if your route has disconnected parts (for example, a street that has separate north and southbound lanes). In that case, you would use this column to identify each distinct segment.
-
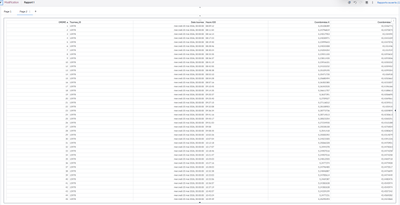
Sequence Column: This is crucial, as it determines the correct drawing order of the data points in your polylines. I'm not sure using a date column is a good choice here, as the values may not be unique across the polylines. Judging from your previous screenshot, the
ORDREcolumn seems like a much better fit. -
Latitude/Longitude: These map to the coordinates in your specified coordinate space.
Once your data provider is ready, assign a geographical data item to the column containing your tour IDs, linking it to that custom provider. Finally, add that geo item to a Geo Line visual. From there, you can apply filters to isolate specific areas of interest, or use additional roles like color and line pattern to differentiate between route types.
Hope this helps!
- Mark as New
- Bookmark
- Subscribe
- Mute
- RSS Feed
- Permalink
- Report Inappropriate Content

It's done !!! Thanks for your help.
- Mark as New
- Bookmark
- Subscribe
- Mute
- RSS Feed
- Permalink
- Report Inappropriate Content


- Mark as New
- Bookmark
- Subscribe
- Mute
- RSS Feed
- Permalink
- Report Inappropriate Content
If your route data includes the points in the correct order, another thing to check is whether it's sorted before it's passed to the map. I've seen routes look odd simply because the observations weren't ordered as expected. Also worth verifying that the latitude/longitude fields are being interpreted as numeric values rather than text.

Call for content now open!
It's your turn to help shape SAS Innovate 2027. Share your expertise and inspire the SAS community.
See how to use one filter for multiple data sources by mapping your data from SAS’ Alexandria McCall.

Find more tutorials on the SAS Users YouTube channel.
-
11 replies
-
06-01-2026 05:19 PM
-
1471 views
-
0 likes
-
4 in conversation
-


