- Home
- /
- SAS Viya
- /
- Visual Analytics
- /
- Re: Handling non-additive measure in Visual Analytics 7.1
- RSS Feed
- Mark Topic as New
- Mark Topic as Read
- Float this Topic for Current User
- Bookmark
- Subscribe
- Mute
- Printer Friendly Page

- Mark as New
- Bookmark
- Subscribe
- Mute
- RSS Feed
- Permalink
- Report Inappropriate Content
Hi,
We have following use case for non-additive measure. We want to know whether it is possible to handle following use case in Visual analytics 7.1 and if yes then how.
Use case as follows :
We have return data at 3 levels of hierarchy. Below figure shows Parent as 1, 2 and 3 are next level nodes and last 4,5,6,7,9,10 are child nodes. Each child node has return value (shown in green color). At the same time we have return data calculated at node 2 & 3, and node 1 again shown in green color.
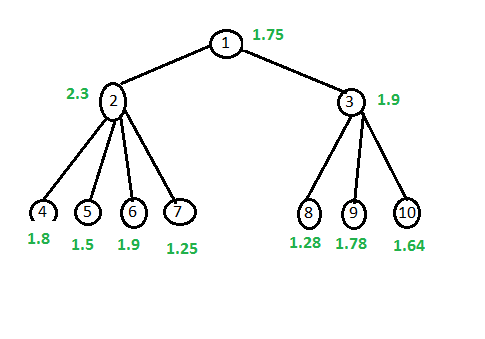
What we want to create is return_pct measure with non-additive nature. So ideally when following reports is created (Figure 1), then it shows correct return values. When we drill up to next level, it shows aggregated value for node 2 & 3 (Figure 2), whereas, it should show real pre-calculated values as 2.3 and 1.9 respectively.
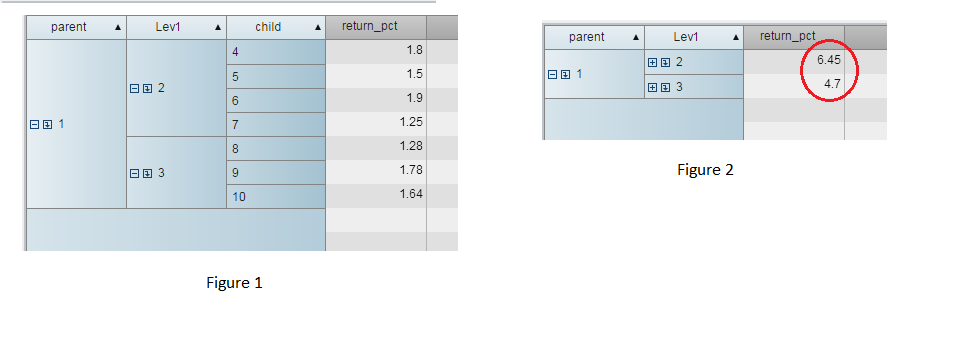
We want to know, how to create non-additive measure so that we can create correct report.
Thanks
~PB

- Mark as New
- Bookmark
- Subscribe
- Mute
- RSS Feed
- Permalink
- Report Inappropriate Content
Hello Prashant,
I asked the development team about this, and we don't think it is currently possible.
Can you tell us any more about the type of data you are working with or what field you are in?
I don't know if this would be helpful, but you could store the values for the upper level nodes in a separate calculated measure for each level. For your Lev1 above, that might look something like,
IF ( 'Lev1'n = '2' )
RETURN 2.3
ELSE (
IF ( 'Lev1'n = '3' )
RETURN 1.9
ELSE .
)
If you set the aggregation type to "Min", then that measure would always contain the correct value for your Lev1 level.
Maybe someone else could offer a better workaround.
Thanks,
Sam

- Mark as New
- Bookmark
- Subscribe
- Mute
- RSS Feed
- Permalink
- Report Inappropriate Content
@Sam_SAS Can you look into my discussion thread? I have a very similar issue but I am dealing with a crosstab using a LASR table.
- Mark as New
- Bookmark
- Subscribe
- Mute
- RSS Feed
- Permalink
- Report Inappropriate Content
- Mark as New
- Bookmark
- Subscribe
- Mute
- RSS Feed
- Permalink
- Report Inappropriate Content
https://communities.sas.com/t5/SAS-Procedures/proc-transpose-incorrect-results/m-p/227278
Sorry I should have posted earlier.

- Mark as New
- Bookmark
- Subscribe
- Mute
- RSS Feed
- Permalink
- Report Inappropriate Content
@PrashantBhatwadekar Did you find the solution or workaround for this? I have the same issue.
.jpg")
Catch up on SAS Innovate 2026
Nearly 200 sessions are now available on demand in the Innovate Hub.
Watch Now →See how to use one filter for multiple data sources by mapping your data from SAS’ Alexandria McCall.

Find more tutorials on the SAS Users YouTube channel.
-
5 replies
-
05-24-2015 11:33 PM
-
4528 views
-
0 likes
-
4 in conversation
-
