- Home
- /
- SAS Viya
- /
- Visual Analytics
- /
- Display "X" at cross section in crosstab report
- RSS Feed
- Mark Topic as New
- Mark Topic as Read
- Float this Topic for Current User
- Bookmark
- Subscribe
- Mute
- Printer Friendly Page
- Mark as New
- Bookmark
- Subscribe
- Mute
- RSS Feed
- Permalink
- Report Inappropriate Content
Hi,
I want to display "X" in the cell at the crosssection of crosstab report, by default it is showing frequency number as 1. instead of this frequency i want to display "X" at crosssection.
current situation:
| X/Y | a | b | c |
| aa | 1 | ||
| bb | 1 | ||
| cc | 1 | ||
| dd |
desired output:
| X/Y | a | b | c |
| aa | X | ||
| bb | X | ||
| cc | X | ||
| dd |
- Mark as New
- Bookmark
- Subscribe
- Mute
- RSS Feed
- Permalink
- Report Inappropriate Content
The output you are seeing is the expected behavior of a crosstab report object. Without a measure data item in a crosstab, the cells represent the frequency of the X/Y combination. If you are wanting to see an X instead, I would suggest implementing a workaround by having a measure in the crosstab and define a SAS user-defined format on the measure such that values greater than 0 are a 'X' and values less than or equal to 0 are ' ' (a blank).
You can create a SAS user-defined format using PROC FORMAT as described at Base SAS(R) 9.4 Procedures Guide, Third Edition - PROC FORMAT and information on how to set up your VA environment to use SAS user-defined formats can be found at SAS(R) Visual Analytics 7.1: User's Guide - Work with User-Defined Formats
Let us know how you go.
Kind Regards,
Michelle
- Mark as New
- Bookmark
- Subscribe
- Mute
- RSS Feed
- Permalink
- Report Inappropriate Content
Hi Pradeep,
Instead of measure values you cant show X....., you can show any numeric value like 0, 2, 3....., In VA Environment.
Thanks,
Teja surapaneni.
- Mark as New
- Bookmark
- Subscribe
- Mute
- RSS Feed
- Permalink
- Report Inappropriate Content
Hi there,
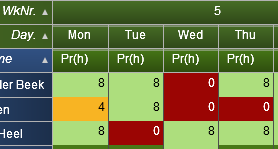
please consider while working in "Visual" analytics to use some colors.
If you assign colors for the "X" and non "X", that really catches the eye.
You can still choose to hide the value's assinging the same color.

Greetings and succes.
Peter
- Mark as New
- Bookmark
- Subscribe
- Mute
- RSS Feed
- Permalink
- Report Inappropriate Content
Good point Peter!
April 27 – 30 | Gaylord Texan | Grapevine, Texas
Registration is open
Walk in ready to learn. Walk out ready to deliver. This is the data and AI conference you can't afford to miss.
Register now and save with the early bird rate—just $795!
See how to use one filter for multiple data sources by mapping your data from SAS’ Alexandria McCall.
Find more tutorials on the SAS Users YouTube channel.


