- Home
- /
- SAS Viya
- /
- Visual Analytics
- /
- Customize the color of treemap
- RSS Feed
- Mark Topic as New
- Mark Topic as Read
- Float this Topic for Current User
- Bookmark
- Subscribe
- Mute
- Printer Friendly Page

- Mark as New
- Bookmark
- Subscribe
- Mute
- RSS Feed
- Permalink
- Report Inappropriate Content
When I use treemap, it seems I can only set the Data Colors
VA changes the colors of meter automatically.
However, can I appoint the color to a specific value?
In the following example, the value has changed since I choice different parameters. But the color is the same.
Can I customized my color setting with fixed value

- Mark as New
- Bookmark
- Subscribe
- Mute
- RSS Feed
- Permalink
- Report Inappropriate Content
Hello SullivanC,
Listed below are step by step instructions on how to customize the colors in order for it to represent a specified value for the Treemap:
First, Access VA.
Go to Create a Report.
From here, select the desired data you want to analyze within your Treemap.
Next, in the objects tab click on Treemap.
Then, put in the desired fields from your data (ex: Product sales, Product Quality, Sales Rep ID, etc.)
From here, on the right side, click on the styles tab.
Next, select Treemap 1 and you should see the following tabs:
Data Styling, Fills, Frame Styling, Text Styling, and Data Colors
Because you want to customize the colors on the Treemap select
the tab, Data Colors, moreover you can select the colors for fill, gradient,
missing, and data tip fill. Here is where you can select the colors to represent a specific value.
In addition, you can customize the text and the style of your Treemap.
I hope I assisted you in answering your question, please reply if you need further clarification.
- Mark as New
- Bookmark
- Subscribe
- Mute
- RSS Feed
- Permalink
- Report Inappropriate Content
Thanks for you replying. I'm sorry I reply late since I have to try in Monday morning in my office.
I have tried solution. But I still cannot find the setting.
I hope to give a specific color to a specific range. For example
0%(green)->70%(yellow)->100%(red)
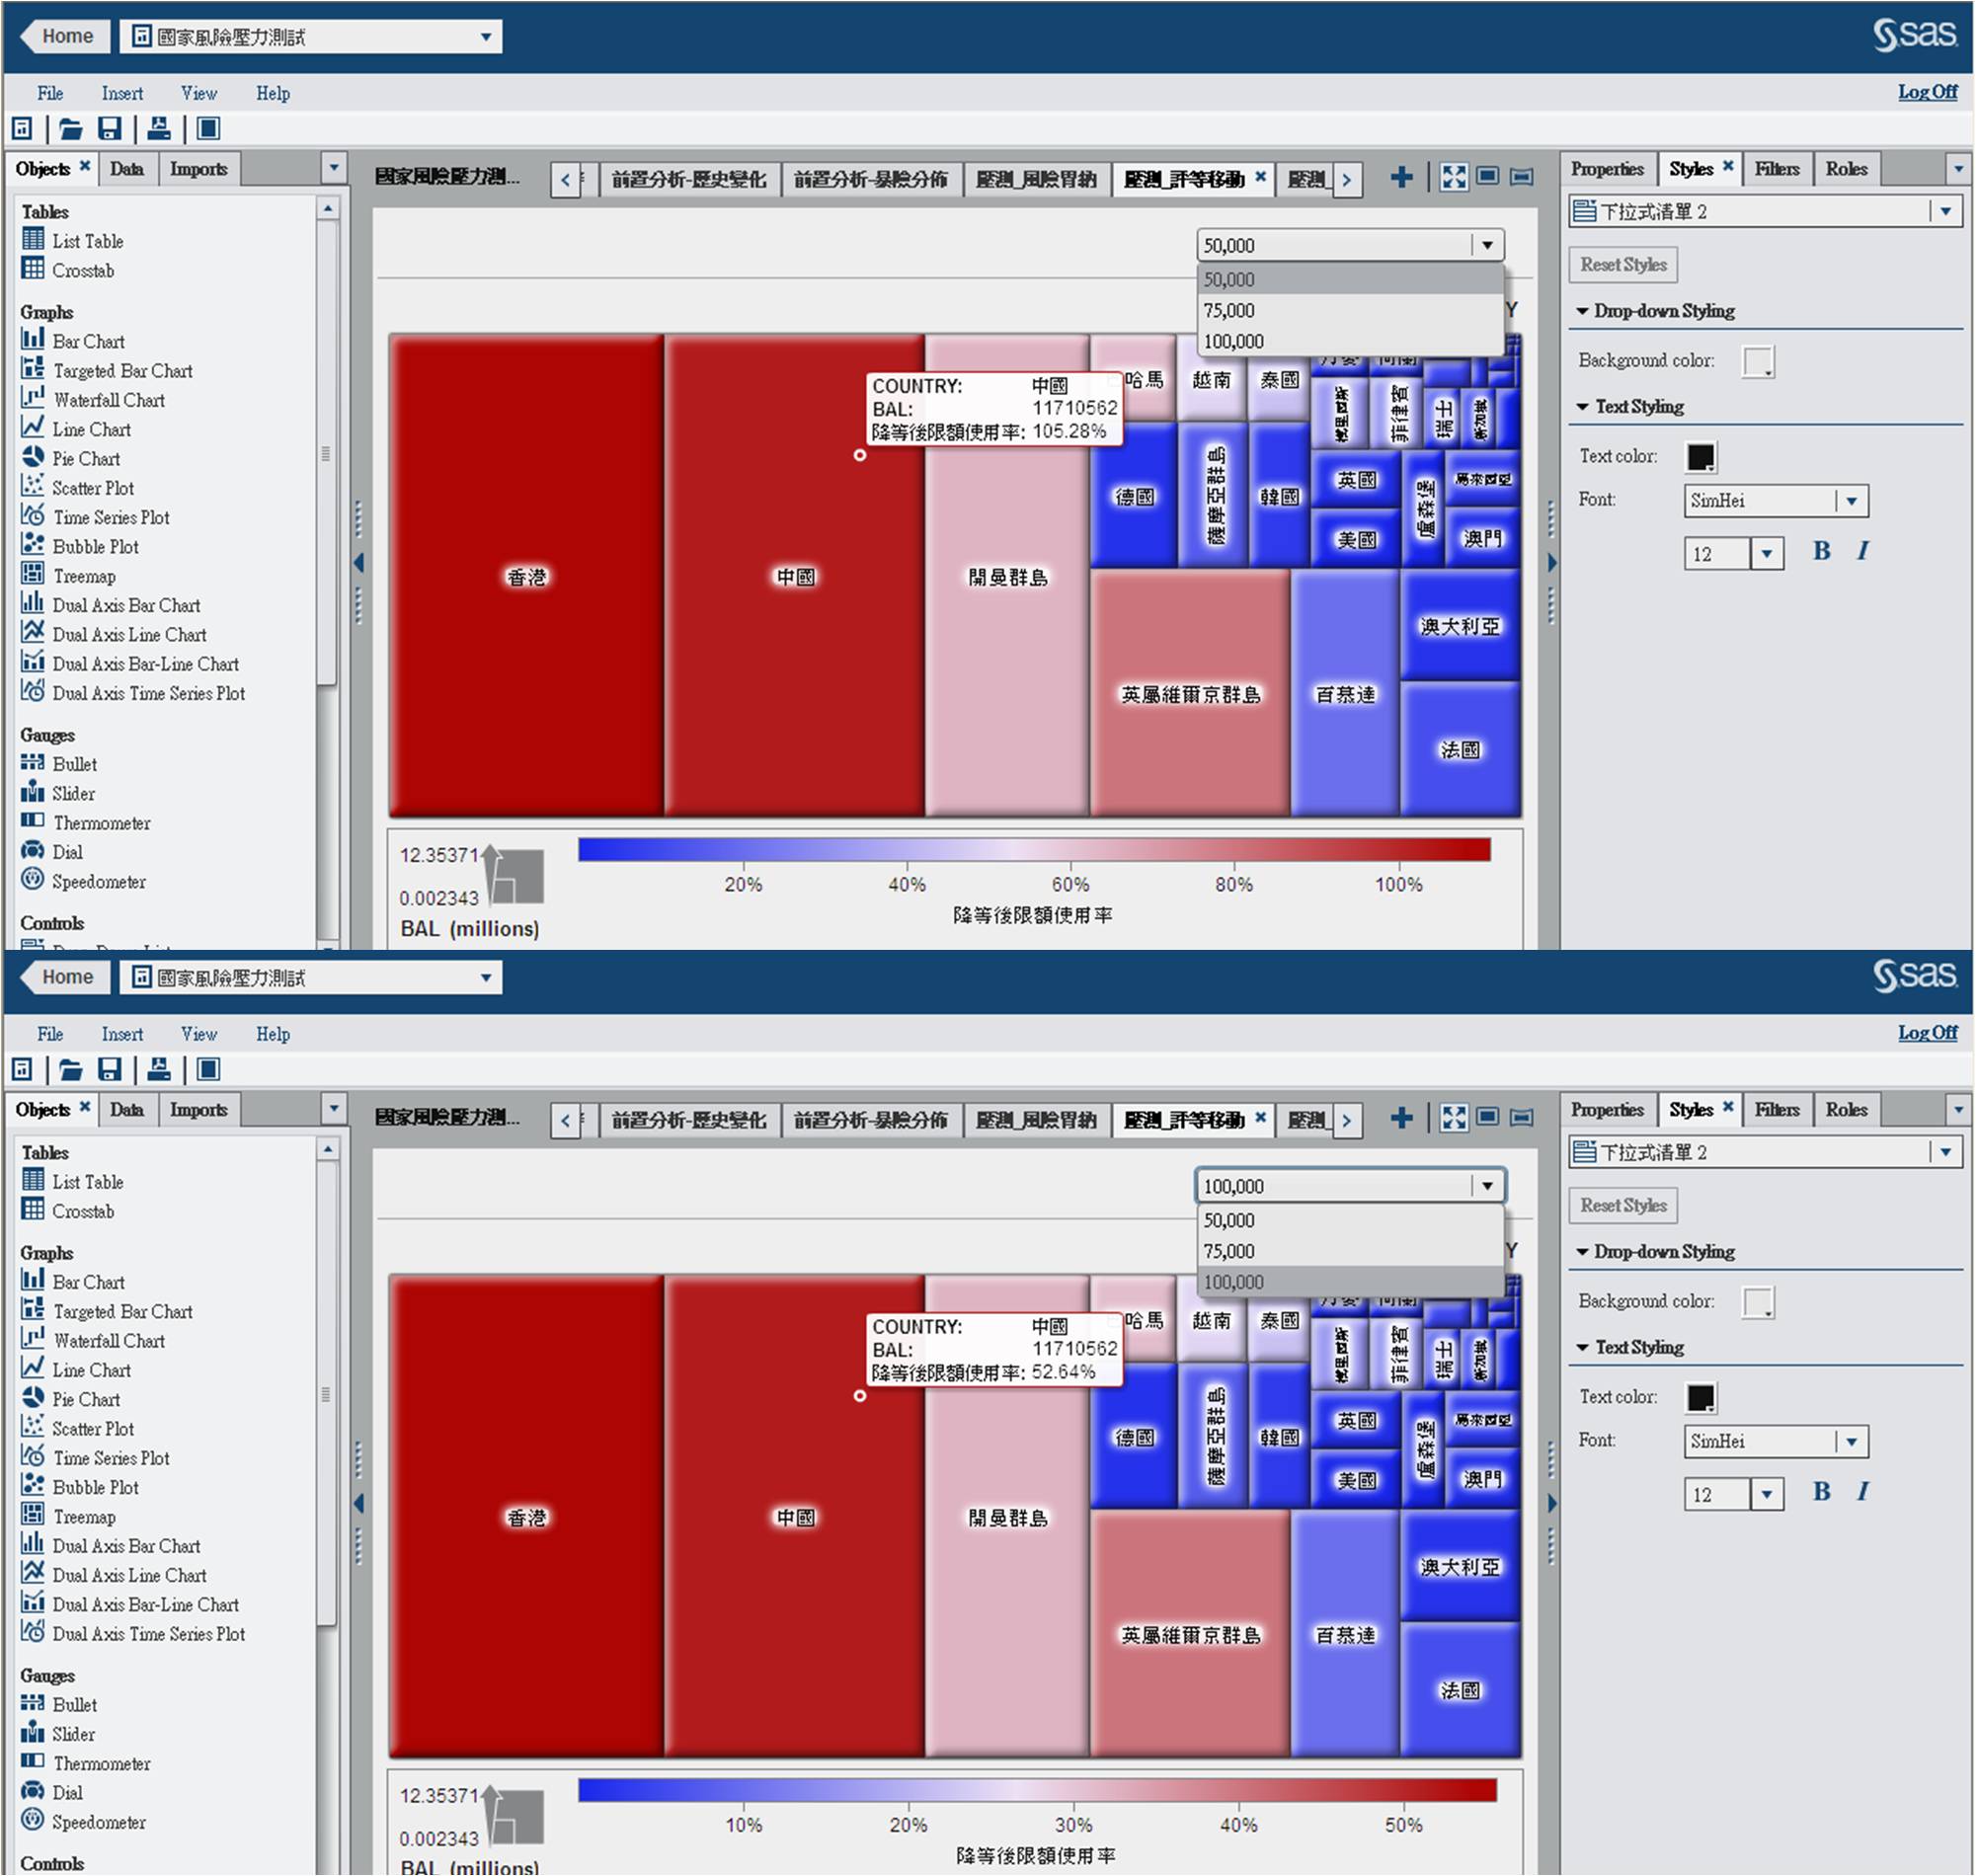
In my example pic, the value of the 1st pic is 105.28% and the value of 2 pic is 52.64%.
The are from the same treemap and I just change the value of controls.
I hope the color of 52.64% become yellow/green, not keep the same color(red) as that of 105.28%

- Mark as New
- Bookmark
- Subscribe
- Mute
- RSS Feed
- Permalink
- Report Inappropriate Content
Hi Sullivan,
Did you attempt doing this in Display rule. There you can specify desired values and make an expression.
Cheers. satlr
.jpg")
Catch up on SAS Innovate 2026
Nearly 200 sessions are now available on demand with the SAS Innovate Digital Pass.
Explore Now →See how to use one filter for multiple data sources by mapping your data from SAS’ Alexandria McCall.

Find more tutorials on the SAS Users YouTube channel.
-
3 replies
-
06-20-2014 06:36 AM
-
4566 views
-
0 likes
-
3 in conversation
-
