- Home
- /
- SAS Viya
- /
- Visual Analytics
- /
- Re: Cumulative Totals
- RSS Feed
- Mark Topic as New
- Mark Topic as Read
- Float this Topic for Current User
- Bookmark
- Subscribe
- Mute
- Printer Friendly Page
- Mark as New
- Bookmark
- Subscribe
- Mute
- RSS Feed
- Permalink
- Report Inappropriate Content
Hi there,
I am brand new to SAS VA so apologies if my question is overly simple.
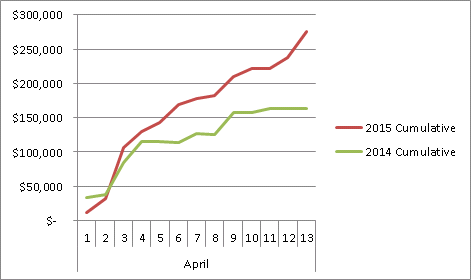
I am trying to produce a graph that shows cumulative sales during a month (by day) compared to the same month last year. (As per image below).
I can't seem to work out how to do this - would appreciate some assistance.
Kind Regards
Paul

- Mark as New
- Bookmark
- Subscribe
- Mute
- RSS Feed
- Permalink
- Report Inappropriate Content
Hi Paul,
The CumulativePeriod operator in an aggregated measure is what you would use to perform this type of task.
Unfortunately, you cannot display cumulative values by day for a year other than the current year.
You can compare cumulative values by month (or by quarter) to the previous year (or quarter).
You can display cumulative values by day for the current year, month, quarter.
It is conceivable there's some workaround I'm not aware of.
Thanks,
Sam
See how to use one filter for multiple data sources by mapping your data from SAS’ Alexandria McCall.
Find more tutorials on the SAS Users YouTube channel.


