- Home
- /
- SAS Viya
- /
- Visual Analytics
- /
- Analytics designer calculated item in a report
- RSS Feed
- Mark Topic as New
- Mark Topic as Read
- Float this Topic for Current User
- Bookmark
- Subscribe
- Mute
- Printer Friendly Page

- Mark as New
- Bookmark
- Subscribe
- Mute
- RSS Feed
- Permalink
- Report Inappropriate Content
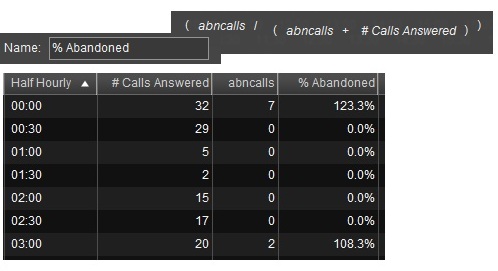
All,
I'm trying to build a simple calculated field in a List Table, that derives out of 2 columns. The formula is pretty straight-forward: New_Field = A / (A + C), however the data coming to New_Field is not correct. The data in the list table is filtered by a few drop-downs for Year, Month and Date and aggregated on a half-hourly basis. There should be something very basic I'm missing here... Any ideas?
Thanks!
Accepted Solutions

- Mark as New
- Bookmark
- Subscribe
- Mute
- RSS Feed
- Permalink
- Report Inappropriate Content
Hi There,
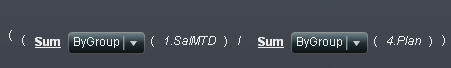
I think you might be looking for the "New Aggregated Measure";
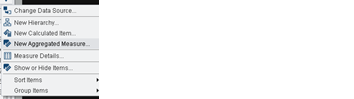
then your formula should look like this (use the sum group by)
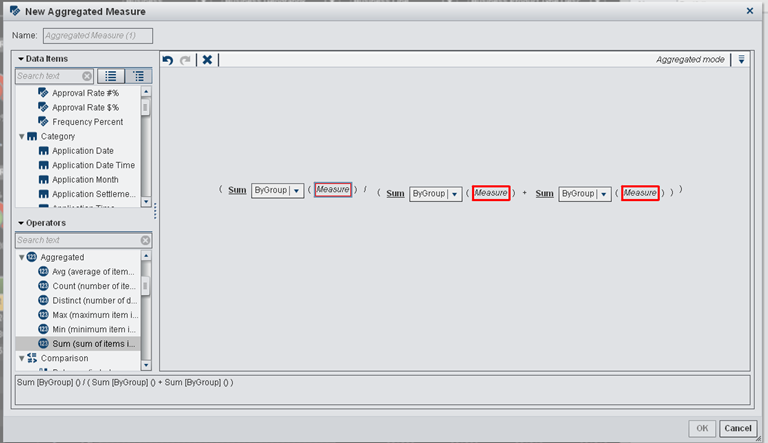
hope that helps
- Mark as New
- Bookmark
- Subscribe
- Mute
- RSS Feed
- Permalink
- Report Inappropriate Content
Hi There,
I think you might be looking for the "New Aggregated Measure";
then your formula should look like this (use the sum group by)
hope that helps

- Mark as New
- Bookmark
- Subscribe
- Mute
- RSS Feed
- Permalink
- Report Inappropriate Content
Dear swamgan,
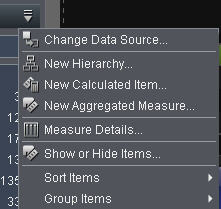
I think you are using the calculated item field that calculates on dataline level.
What you need is an Aggregated Measure, because this one can calculates on group level.
This functionality is present in VA 6.2 and not in 6.1
It looks like this.
Shure this will solve your problem.
Greetings
- Mark as New
- Bookmark
- Subscribe
- Mute
- RSS Feed
- Permalink
- Report Inappropriate Content
Thanks to you both, apparently I don't have 6.2 yet.
.jpg")
Catch up on SAS Innovate 2026
Nearly 200 sessions are now available on demand in the Innovate Hub.
Watch Now →See how to use one filter for multiple data sources by mapping your data from SAS’ Alexandria McCall.

Find more tutorials on the SAS Users YouTube channel.
-
3 replies
-
12-09-2013 04:35 PM
-
3106 views
-
3 likes
-
3 in conversation
-
