- Home
- /
- Programming
- /
- Programming
- /
- Re: p-value for proportions of variables btw included & excluded
- RSS Feed
- Mark Topic as New
- Mark Topic as Read
- Float this Topic for Current User
- Bookmark
- Subscribe
- Mute
- Printer Friendly Page

- Mark as New
- Bookmark
- Subscribe
- Mute
- RSS Feed
- Permalink
- Report Inappropriate Content
Hi,
I am trying to calculate p-value for differences between categorical AND continuous variables. I have included and excluded observations, and want to determine if the proportions for categories within each variable are the same as well as comparing mean (SD) for continuous measures between included & excluded.
To illustrate, here is my Table 1. Trying to calculate that p-value for each row.
Thank you!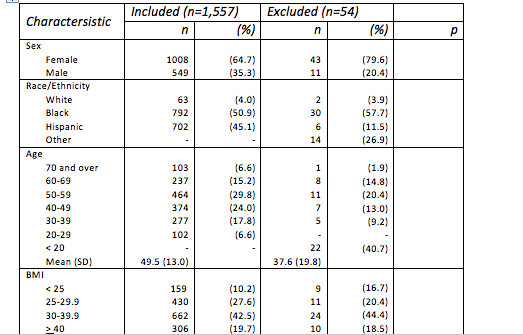

- Mark as New
- Bookmark
- Subscribe
- Mute
- RSS Feed
- Permalink
- Report Inappropriate Content
Hi,
It is very essential to know, what kind of statistics you wish to apply to get the p values for different categories. I mean if you wish to get the p values of chi square or fisher exact , then you can use the following code
this is for sex:
proc freq data = dataset;
where sex ne '' and trt in ("included","excluded");
table sex* trt / exact;
output out = pvalue exact;
run;
this is for race:
proc freq data = dataset;
where race ne '' and trt in ("included","excluded");
table race* trt / exact;
output out = pvalue exact;
run;
this is for age:
proc freq data = dataset;
where age ne '' and trt in ("included","excluded");
table age* trt / exact;
output out = pvalue exact;
run;
you can apply the same to other categories as well and get the p values.
Hope this helps you.
Thanks,
Jagadish
Jag
- Mark as New
- Bookmark
- Subscribe
- Mute
- RSS Feed
- Permalink
- Report Inappropriate Content
Thanks much, Jagadish.
This is very helpful.
I am trying to get chi-square, but how do I do so for EACH CATEGORY within a variable.
For instance, if I want to get chi-square for each age group ( 70+, 60-69, 50-59, etc.), between included & excluded, is there a way to do so? It seems the code above just gets me chi-square for overall difference between included and excluded for the variable age instead of each age category.
- Mark as New
- Bookmark
- Subscribe
- Mute
- RSS Feed
- Permalink
- Report Inappropriate Content
Yes its possible, please use the by statement with age group as the variable, so it will give p values for each group with the age.
proc freq data = dataset;
where age ne '' and trt in ("included","excluded");
by age;
table age*trt / exact;
output out = pvalue exact;
run;
Thanks,
Jagadish
Jag
- Mark as New
- Bookmark
- Subscribe
- Mute
- RSS Feed
- Permalink
- Report Inappropriate Content
Ok, now I only get a 2x2 table with no exact test. Here is my code:
proc freq data = joe.extrainclude;
where age10yrs ne . and include in (0,1);
table age10yrs* include / exact;
output out = pvalue exact;
by age10yrs;
run;
Where the variable "include" is 0=observations to include and 1=observations to exclude
but my output doesn't make any sense.
Am I running something wrong?
- Mark as New
- Bookmark
- Subscribe
- Mute
- RSS Feed
- Permalink
- Report Inappropriate Content
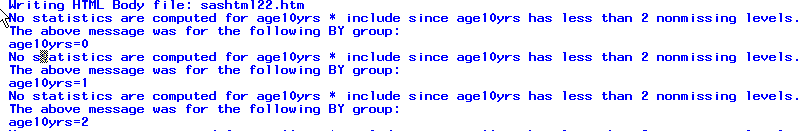
and this is the error message i get in my log:
Data set JOE.EXTRAINCLUDE is not sorted in ascending sequence. The current BY group has age10yrs = 4 and the next BY group
has age10yrs = 1.
- Mark as New
- Bookmark
- Subscribe
- Mute
- RSS Feed
- Permalink
- Report Inappropriate Content
This is because you need to sort the dataset by proc sort before passing that dataset into proc freq.
like this,
proc sort data = joe.extrainclude;
by age10yrs;
run;
Try this and let me know if this has worked for you.
Thanks,
Jagadish
Jag
- Mark as New
- Bookmark
- Subscribe
- Mute
- RSS Feed
- Permalink
- Report Inappropriate Content
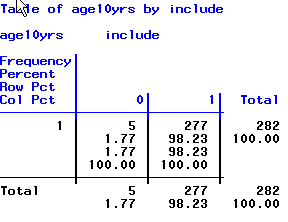
No, now I get a different message, and I still cannot get the exact test because each category within age10yrs variable is computed separately.
- Mark as New
- Bookmark
- Subscribe
- Mute
- RSS Feed
- Permalink
- Report Inappropriate Content
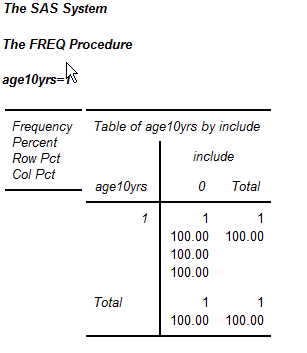
And my output looks like this, for each category of the age10yrs variable, with no exact test ever done:

- Mark as New
- Bookmark
- Subscribe
- Mute
- RSS Feed
- Permalink
- Report Inappropriate Content
It looks like you need binomial tests. Try:
proc freq data = dataset;
where age ne '' and trt in ("included","excluded");
by age;
table trt / binomial;
exact binomial;
output out = pvalue binomial;
run;
Steve Denham
.jpg")
Catch up on SAS Innovate 2026
Nearly 200 sessions are now available on demand in the Innovate Hub.
Watch Now →Learn how use the CAT functions in SAS to join values from multiple variables into a single value.

Find more tutorials on the SAS Users YouTube channel.
SAS Training: Just a Click Away
Ready to level-up your skills? Choose your own adventure.
-
9 replies
-
07-10-2013 10:33 PM
-
4155 views
-
6 likes
-
3 in conversation
-
