- Home
- /
- Programming
- /
- Programming
- /
- Re: Restricted cubic splines in proportional hazard regression
- RSS Feed
- Mark Topic as New
- Mark Topic as Read
- Float this Topic for Current User
- Bookmark
- Subscribe
- Mute
- Printer Friendly Page
- Mark as New
- Bookmark
- Subscribe
- Mute
- RSS Feed
- Permalink
- Report Inappropriate Content
PROC PHREG DATA=XXX;
 effect fibreS = spline(fibre / basis=tpf(noint) NATURALCUBIC details knotmethod=rangefractions(0.05 0.50 0.95) );
    model survival*Censor(0)=fibreS  / rl ;
    run;
Hi All,
For a project, I want to perform restricted cubic splines since my prop. hazard analyses indicate the association between fibre and survival might not be linear.
However, I am not really used working with SAS and I got stuck making my syntax. I think the part I have is alright, however, I do not seem to get any graphical output figures. Could someone help me with the last part?
Thanks in advance!
- Mark as New
- Bookmark
- Subscribe
- Mute
- RSS Feed
- Permalink
- Report Inappropriate Content
Did you enable ODS Graphics?
ods graphics on;
It might or might not be enabled by default.
Do the graphs you want need to be requested by the PLOTS= option in the PROC statement or by specifying the EFFECTPLOT statement?
- Mark as New
- Bookmark
- Subscribe
- Mute
- RSS Feed
- Permalink
- Report Inappropriate Content
Thanks for your reply. I have ods graphics enabled.
I thought the graphics needed to be requested with proc plot or proc sgplot, but as I am relatively new to sas I'm sure whether this is right.
- Mark as New
- Bookmark
- Subscribe
- Mute
- RSS Feed
- Permalink
- Report Inappropriate Content
PROC PLOT is ancient technology. Don't use it. PROC SGPLOT is enormously useful, but you might or might not need it. Many procedures automatically create some graphs relevant to the analysis and optionally create others. Look at the PHREG doc. For more about ODS Graphics and SAS/STAT procs, see
http://support.sas.com/documentation/onlinedoc/stat/141/odsgraph.pdf
- Mark as New
- Bookmark
- Subscribe
- Mute
- RSS Feed
- Permalink
- Report Inappropriate Content
Thank you for the document. I do not see an option to plot RCS within this document. Do I need to perform another step to create graphs?
- Mark as New
- Bookmark
- Subscribe
- Mute
- RSS Feed
- Permalink
- Report Inappropriate Content
Indeed I do not find "RCS" in the PROC PHREG documentation, so unless it has some other name, you might have to use PROC SGPLOT.
- Mark as New
- Bookmark
- Subscribe
- Mute
- RSS Feed
- Permalink
- Report Inappropriate Content
Just dawned on me. By RCS, do you mean restricted cubic splines? I really don't know what plot you are looking for.
- Mark as New
- Bookmark
- Subscribe
- Mute
- RSS Feed
- Permalink
- Report Inappropriate Content
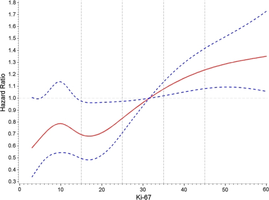
I have a picture added to my reply. Yes, I mean restricted cubic splines. I want a plot with the hazard ratio on the y-axis and fiber intake on the x-axis. If I run my syntax, I get some output in tables. The same kind of output you would get if you would run a proc phreg without spline specified in the effects statement.
- Mark as New
- Bookmark
- Subscribe
- Mute
- RSS Feed
- Permalink
- Report Inappropriate Content
Sorry I can't be more help. Now that you have shown what you want, I hope someone else can help you.
- Mark as New
- Bookmark
- Subscribe
- Mute
- RSS Feed
- Permalink
- Report Inappropriate Content
No problem. I appreciate you taking the time!
- Mark as New
- Bookmark
- Subscribe
- Mute
- RSS Feed
- Permalink
- Report Inappropriate Content
Hi Mrite,
I am doing the same analysis as yours. The hazard analysis shows that the association between Bicarb (LBXSC3SI) and survival is not linear. Thus, I want to plot restricted cubic splines in proportional hazard regression.
I used the following code
PROC PHREG DATA = survey;
effect LBXSC3SIs = spline(LBXSC3SI / basis=tpf(noint) NATURALCUBIC details knotmethod=rangefractions(0.05 0.50 0.95) );
model years*dead (0) = LBXSC3SIs / rl;
run;
ods graphics on;
However, I do not see any plot/graph in the SAS output. Did you find any solution for your code?
April 27 – 30 | Gaylord Texan | Grapevine, Texas
Registration is open
Walk in ready to learn. Walk out ready to deliver. This is the data and AI conference you can't afford to miss.
Register now and lock in 2025 pricing—just $495!
Learn how use the CAT functions in SAS to join values from multiple variables into a single value.
Find more tutorials on the SAS Users YouTube channel.
SAS Training: Just a Click Away
Ready to level-up your skills? Choose your own adventure.


