- Home
- /
- Programming
- /
- Programming
- /
- Re: Formatting the scree plot x-axis in proc factor
- RSS Feed
- Mark Topic as New
- Mark Topic as Read
- Float this Topic for Current User
- Bookmark
- Subscribe
- Mute
- Printer Friendly Page


- Mark as New
- Bookmark
- Subscribe
- Mute
- RSS Feed
- Permalink
- Report Inappropriate Content
PROC TEMPLATE;
Accepted Solutions


- Mark as New
- Bookmark
- Subscribe
- Mute
- RSS Feed
- Permalink
- Report Inappropriate Content
You could save these data firstly ,afterwards polt it by PROC SGPLOT.
ods select none;
ods output ScreePlot=ScreePlot;
PROC FACTOR DATA = sashelp.heart METHOD=PRINCIPAL PRIORS=SMC RESIDUAL
ROTATE=VARIMAX OUTSTAT=OUTSTAT
PLOTS(UNPACK)=SCREE REORDER  ;
  VAR _numeric_ ;
RUN;
ods select all;


%let n=6;  /*the number of factors you want to display*/
proc sgplot data=ScreePlot(where=(number<=&n.));
series x=number y=Eigenvalue/markers;
run;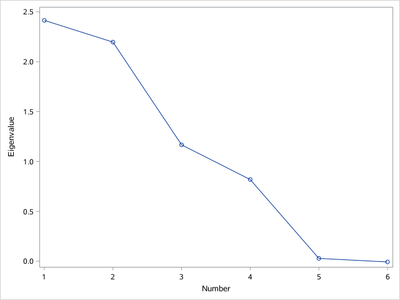
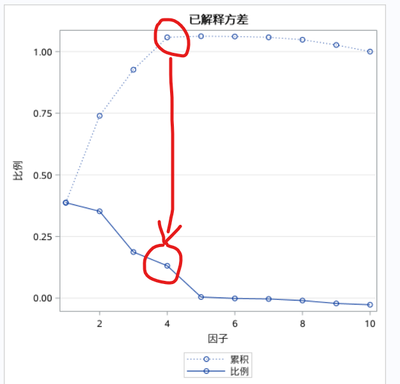
Or you could check the next graph "the explained variance" to find elbow point ?

- Mark as New
- Bookmark
- Subscribe
- Mute
- RSS Feed
- Permalink
- Report Inappropriate Content
Did you look at the Proc Factor option NPLOTS= to limit the number of factors plotted?
- Mark as New
- Bookmark
- Subscribe
- Mute
- RSS Feed
- Permalink
- Report Inappropriate Content
You could save these data firstly ,afterwards polt it by PROC SGPLOT.
ods select none;
ods output ScreePlot=ScreePlot;
PROC FACTOR DATA = sashelp.heart METHOD=PRINCIPAL PRIORS=SMC RESIDUAL
ROTATE=VARIMAX OUTSTAT=OUTSTAT
PLOTS(UNPACK)=SCREE REORDER  ;
  VAR _numeric_ ;
RUN;
ods select all;


%let n=6;  /*the number of factors you want to display*/
proc sgplot data=ScreePlot(where=(number<=&n.));
series x=number y=Eigenvalue/markers;
run;
Or you could check the next graph "the explained variance" to find elbow point ?
- Mark as New
- Bookmark
- Subscribe
- Mute
- RSS Feed
- Permalink
- Report Inappropriate Content
This worked! Thank you!

Call for content now open!
It's your turn to help shape SAS Innovate 2027. Share your expertise and inspire the SAS community.
Learn how use the CAT functions in SAS to join values from multiple variables into a single value.

Find more tutorials on the SAS Users YouTube channel.
SAS Training: Just a Click Away
Ready to level-up your skills? Choose your own adventure.
-
3 replies
-
04-04-2024 03:14 PM
-
3554 views
-
2 likes
-
3 in conversation
-

