- Home
- /
- Programming
- /
- Programming
- /
- Re: Draw a sold black line after the first row in proc report
- RSS Feed
- Mark Topic as New
- Mark Topic as Read
- Float this Topic for Current User
- Bookmark
- Subscribe
- Mute
- Printer Friendly Page

- Mark as New
- Bookmark
- Subscribe
- Mute
- RSS Feed
- Permalink
- Report Inappropriate Content
hai all Please do help me?
I would like to know how to draw a solid black line after the first row in proc report?? :smileyplain:
Thanks
Krishna

- Mark as New
- Bookmark
- Subscribe
- Mute
- RSS Feed
- Permalink
- Report Inappropriate Content
Maybe provide an example of where you want the output to look like. Does under the first row mean, under column headers, before first row of data, after first row of data, do you want it on all pages, or only the first. Etc. You could for instance if its after the first row of data only on page 1, have a variable in your data with Y in the first record, set it as noprint in your proc report. Then have a compute after that variable, line "-----".
- Mark as New
- Bookmark
- Subscribe
- Mute
- RSS Feed
- Permalink
- Report Inappropriate Content
Hai
I need to draw the solid line only after the first row(n%rows)... Do you help me to solve this crises
- Mark as New
- Bookmark
- Subscribe
- Mute
- RSS Feed
- Permalink
- Report Inappropriate Content
That's to do with your styles. You can update your style template, or in your report specify it:
proc report data = YOUR_DATA nowd split="~" style(header)=[borderbottomwidth=1 borderbottomcolor=black]; /* Change the 1 to whatever width you like */
- Mark as New
- Bookmark
- Subscribe
- Mute
- RSS Feed
- Permalink
- Report Inappropriate Content
But the n% row is not a header part.
- Mark as New
- Bookmark
- Subscribe
- Mute
- RSS Feed
- Permalink
- Report Inappropriate Content
That depends on your data, and how you setup your headers. I assume you have something like:
proc report ...;
columns COL1 ("ABI-007 + Gemcitabine~{newline}(N=22)" COL2 COL3 ...;
Post your report code if not.

- Mark as New
- Bookmark
- Subscribe
- Mute
- RSS Feed
- Permalink
- Report Inappropriate Content
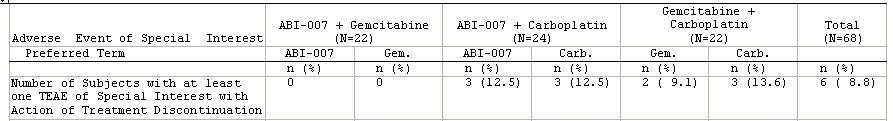
n (%) is redundant put it in the title
Table: 14-06-zz-x Summary n(%) of Adverse Events .....
- Mark as New
- Bookmark
- Subscribe
- Mute
- RSS Feed
- Permalink
- Report Inappropriate Content
Do you know what, I actually had to look at that output several times before I even noticed the row of n (%)'s. Concur with data _null_; it should not be there.
- Mark as New
- Bookmark
- Subscribe
- Mute
- RSS Feed
- Permalink
- Report Inappropriate Content
Of course I'm sure the consumers of the report will insist it be done that way. I think the OP can have "his" cake eat it too if the line of "n (%)" is made part of the data.
- Mark as New
- Bookmark
- Subscribe
- Mute
- RSS Feed
- Permalink
- Report Inappropriate Content
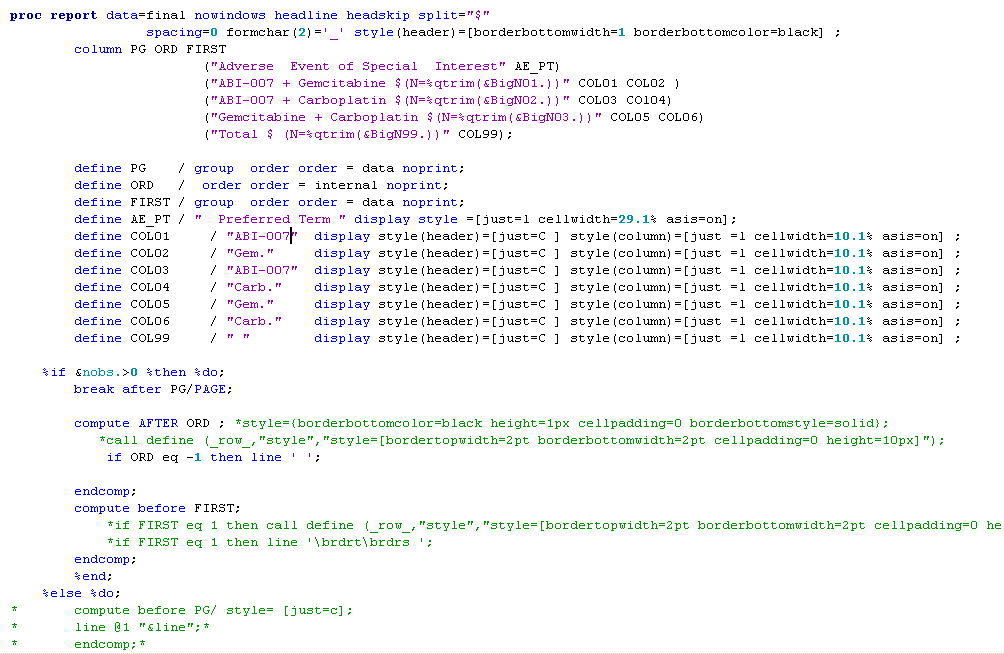
But i need the n% as a separated row .It should be styled with solid black color for top and bottom.I already got the top solid black line and looking for the Bottom??
- Mark as New
- Bookmark
- Subscribe
- Mute
- RSS Feed
- Permalink
- Report Inappropriate Content
Make an WORKING example program that shows what you have so far.
- Mark as New
- Bookmark
- Subscribe
- Mute
- RSS Feed
- Permalink
- Report Inappropriate Content
This is my code spinet for report
- Mark as New
- Bookmark
- Subscribe
- Mute
- RSS Feed
- Permalink
- Report Inappropriate Content
By WORKING I mean an example with data (or SASHELP data) that I can copy and paste and run using "my" SAS.
- Mark as New
- Bookmark
- Subscribe
- Mute
- RSS Feed
- Permalink
- Report Inappropriate Content
ok thanx

- Mark as New
- Bookmark
- Subscribe
- Mute
- RSS Feed
- Permalink
- Report Inappropriate Content
Hi: To add a comment to DATA_NULL_'s suggestion, please post ALL your code. Most SAS sessions either produce HTML output or EG default output -- let us know your destination requirements by showing your ODS statements. For example, is this output you want RTF, PDF, HTML, or some other destination? That is crucial information when you are talking about interior table lines. For example, refer to this previous forum posting and if you run the code, note how the different destinations interpret the border controls differently. https://communities.sas.com/message/238315#238315 (see posted code from Nov 18th).
cynthia
.jpg")
Catch up on SAS Innovate 2026
Nearly 200 sessions are now available on demand with the SAS Innovate Digital Pass.
Explore Now →Learn how use the CAT functions in SAS to join values from multiple variables into a single value.

Find more tutorials on the SAS Users YouTube channel.
SAS Training: Just a Click Away
Ready to level-up your skills? Choose your own adventure.
-
17 replies
-
11-20-2014 08:56 AM
-
7603 views
-
0 likes
-
4 in conversation
-
