- Home
- /
- Programming
- /
- Programming
- /
- Draw a sold black line after the first row in proc report
- RSS Feed
- Mark Topic as New
- Mark Topic as Read
- Float this Topic for Current User
- Bookmark
- Subscribe
- Mute
- Printer Friendly Page

- Mark as New
- Bookmark
- Subscribe
- Mute
- RSS Feed
- Permalink
- Report Inappropriate Content
Hai Cynthia am looking for only RTF
- Mark as New
- Bookmark
- Subscribe
- Mute
- RSS Feed
- Permalink
- Report Inappropriate Content
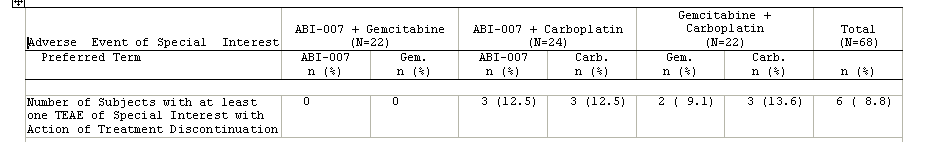
Hai Is there any possible way to draw the black solid line for the top of all n(%). I need a row separation

- Mark as New
- Bookmark
- Subscribe
- Mute
- RSS Feed
- Permalink
- Report Inappropriate Content
Hi:
It looks like you are NOT using the default fonts for RTF and I do NOT see where you are changing the fonts to Courier or some other serif font. How did you take this screen shot? Was this report produced with the code you posted. You said that you wanted RTF but you do NOT show all your code. What does your ODS RTF invocation look like? What style template or STYLE= option do you use? Do you use a custom style template? Did you write the style template? If not, and you ARE using a style template, then the person who wrote the style template should be able to help you get the formatting your want. Have you tried the Journal style with RTF -- that was designed for this type of demographic report or Adverse Even report. For example, a slight modification of the program I posted produces this output, that shows a line underneath the headers, just using the JOURNAL style.
cynthia
- « Previous
-
- 1
- 2
- Next »
.jpg")
Catch up on SAS Innovate 2026
Nearly 200 sessions are now available on demand in the Innovate Hub.
Watch Now →Learn how use the CAT functions in SAS to join values from multiple variables into a single value.

Find more tutorials on the SAS Users YouTube channel.
SAS Training: Just a Click Away
Ready to level-up your skills? Choose your own adventure.
-
17 replies
-
11-20-2014 08:56 AM
-
7750 views
-
0 likes
-
4 in conversation
-
