- Home
- /
- Programming
- /
- SAS Procedures
- /
- Re: Summing observations by two different variables
- RSS Feed
- Mark Topic as New
- Mark Topic as Read
- Float this Topic for Current User
- Bookmark
- Subscribe
- Mute
- Printer Friendly Page

- Mark as New
- Bookmark
- Subscribe
- Mute
- RSS Feed
- Permalink
- Report Inappropriate Content
I have a data set that contains the variables: age sex n pop area period. So the initial dataset looks something like this:
sex age area n pop period
1 1 3 20 20 1995
1 1 2 5 275 1995
1 1 1 10 300 1995
1 2 3 8 310 1995
1 2 2 26 280 1995
Age goes up through '12' and then this is repeated for sex '1' and '2' and areas '1', '2', and '3' for each calendar year through 2011. So after importing the Excel sheet, I deleted age and sex because I first want to do analyses just by area over time (then later by age group). I was told that the formatting of the data in Excel might be why I am getting some errors when I go to do the negative binomial regression, so I wanted to try deleting age / sex and then summing n and pop for each area for each year (e.g., sum of n and sum of pop for areas 1, 2, and 3 respectively for 1995, 1996, and so on).
I tried sorting the data set by area and period and creating new variables 'nsum' and 'popsum' and counting by using:
'if area=1 and period=1995 then;
do;
nsum=0;
popsum=0;
end;
nsum=nsum+n
popsum=popsum+pop
However, then I still have one row for each age group / sex that has now been deleted and I only get area 1 and period 1995 back in the output. For example:
area period nsum popsum
1 1995 450 2890
1 1995 200 1200
1 1995 130 680
1 1995 222 1354
I saw some examples online for how to collapse observations by group, but I am not sure how to sum observations by area AND period so I need to figure out what that code should look like. Thanks!
Accepted Solutions

- Mark as New
- Bookmark
- Subscribe
- Mute
- RSS Feed
- Permalink
- Report Inappropriate Content
"I was told that the formatting of the data in Excel might be why I am getting some errors when I go to do the negative binomial regression"
If you can be more specific then may be someone can help you with fixing your data and you don't need to go for a work-around.
As for your specific question : There is no need to drop variables only because you want to use all of them. You could do the summing in a data step but there are also multiple SAS Proc's which can do this job with less coding for you. Below one possibility using PROC SQL.
data have;
infile datalines truncover;
input (sex age area n pop period) (:8.);
datalines;
1 1 3 20 20 1995
1 1 2 5 275 1995
1 1 1 10 300 1995
1 2 3 8 310 1995
1 2 2 26 280 1995
;
run;
proc sql;
create table want as
select area, period, sum(n) as nsum, sum(pop) as popsum
from have
group by area, period
;
quit;

- Mark as New
- Bookmark
- Subscribe
- Mute
- RSS Feed
- Permalink
- Report Inappropriate Content
If you are okay with proc sql then following may generate what you are looking for.
proc sql;
create table want as
select period,area,sum(n) as nsum,sum(pop) as popsum
from have
group by period, area;
quit;
- Mark as New
- Bookmark
- Subscribe
- Mute
- RSS Feed
- Permalink
- Report Inappropriate Content
"I was told that the formatting of the data in Excel might be why I am getting some errors when I go to do the negative binomial regression"
If you can be more specific then may be someone can help you with fixing your data and you don't need to go for a work-around.
As for your specific question : There is no need to drop variables only because you want to use all of them. You could do the summing in a data step but there are also multiple SAS Proc's which can do this job with less coding for you. Below one possibility using PROC SQL.
data have;
infile datalines truncover;
input (sex age area n pop period) (:8.);
datalines;
1 1 3 20 20 1995
1 1 2 5 275 1995
1 1 1 10 300 1995
1 2 3 8 310 1995
1 2 2 26 280 1995
;
run;
proc sql;
create table want as
select area, period, sum(n) as nsum, sum(pop) as popsum
from have
group by area, period
;
quit;
- Mark as New
- Bookmark
- Subscribe
- Mute
- RSS Feed
- Permalink
- Report Inappropriate Content
Thanks! PROC SQL worked for that.
As for the errors bit that I mentioned, there are a few. So with the data summed, I have variables area, period, nsum, and popsum. For the negative binomial regression, I am using the log of popsum, so logpop is the fifth variable, created by:
data want1;
set want;
logpop = log(popsum);
run;
So the data set then looks something like:
area period nsum popsum logpop
1 1995 10002 39012 10.57162
1 1996 9574 40626 10.61216
1 1997 7983 40100 10.59913
1 1998 11298 41943 10.64406
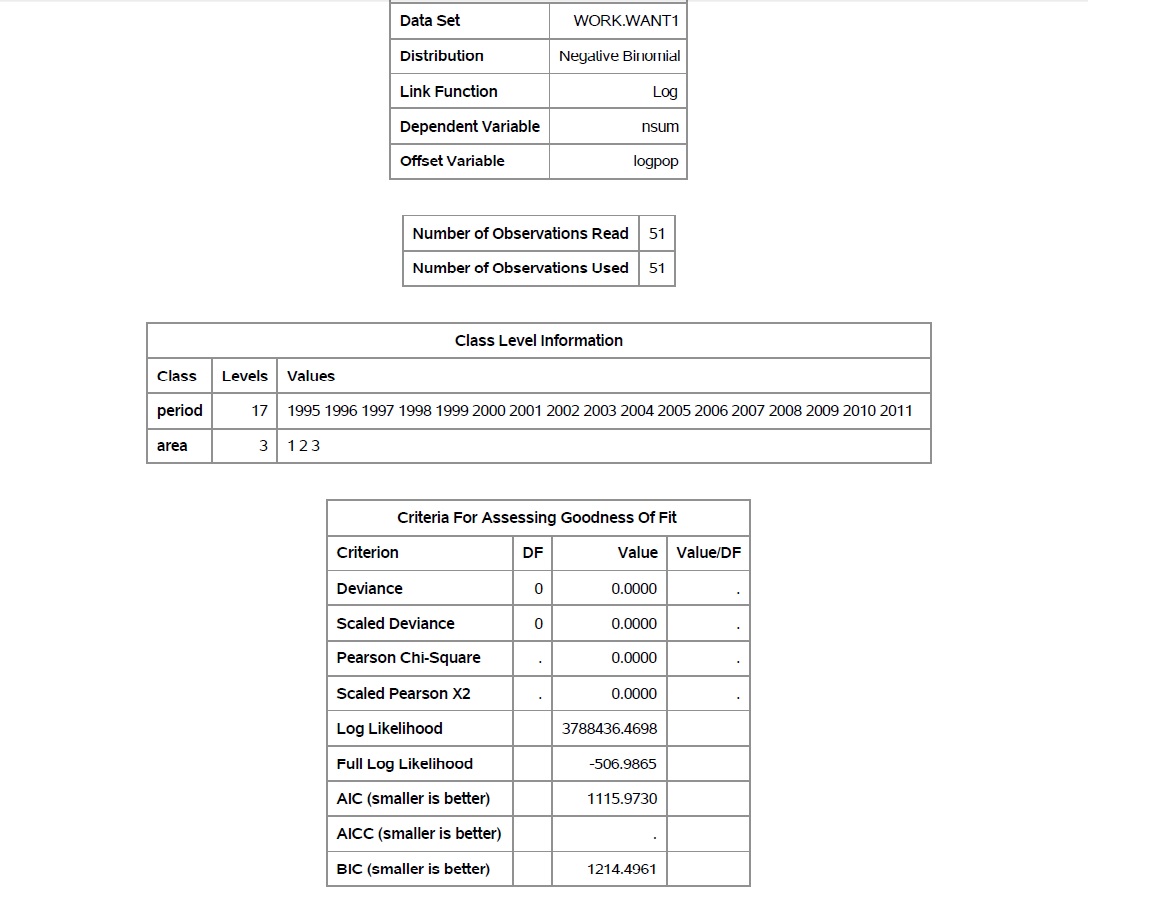
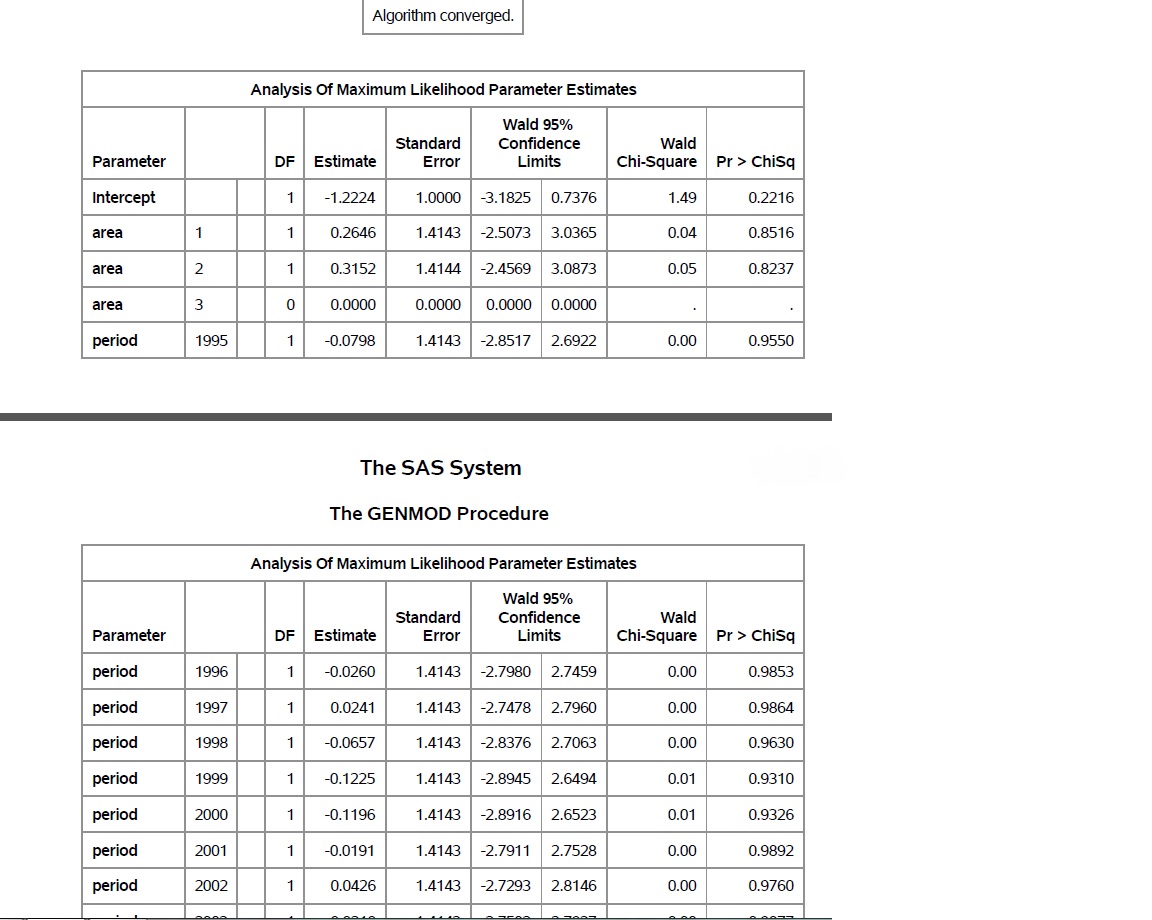
With areas '1', '2', and '3' having data for each year from 1995 through 2011. So to run the regression (for which the main interest is to see if area and period together are significant predictors of nsum, that is, if n varies over time AND between areas), I did:
proc genmod data=want1;
class period area;
model nsum=area period area*period /dist=NB link=log offset=logpop type1;
run;
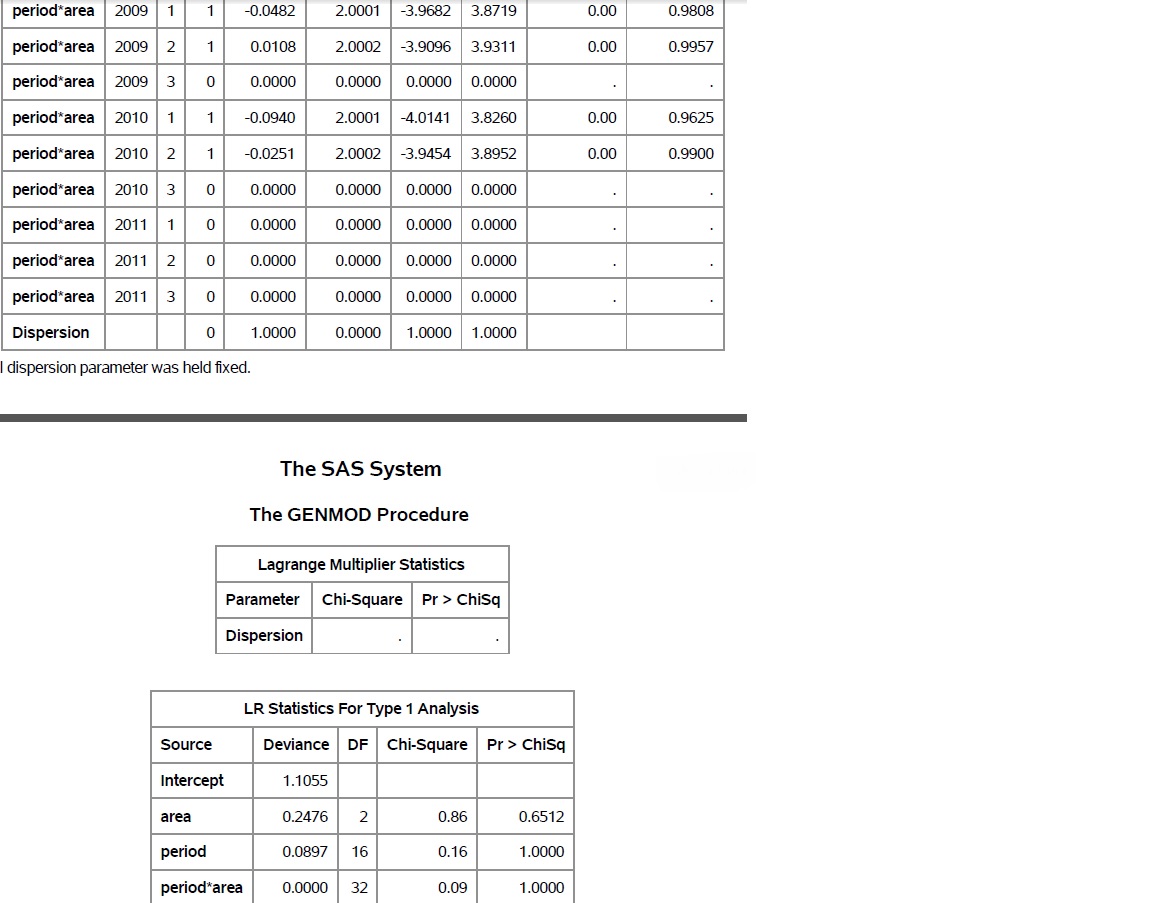
So the first thing I was told is that there may be some errors because of the zeros in the goodness of fit box. I've inserted images of the output (I skipped a couple of pages where it's going through the estimates for period and area) to show an example of what I mean. The p-value for LR Stats for Type 1 Analysis for the period*area interaction comes back as 1.000, which is a problem, but I don't know why it is returning that result (I don't know if this has to do with the zeros in the goodness of fit component or not, but there are no cells with missing values and there are 51 observations all with fairly large nsum and popsum values so I don't think that it would be due to small numbers).
Once I started working with some of the age group data, I started getting some Hessian errors, but I think that is because the cell numbers are too small so I need to combine some age groups.
Thanks again!
- Mark as New
- Bookmark
- Subscribe
- Mute
- RSS Feed
- Permalink
- Report Inappropriate Content
Oh, so this is more about understanding what and why Proc Genmod returns such results and not actual data issues. Not my area.
I suggest you post this as a new question in one of the Analytics forums. You will likely get the best advice if you can provide/mock-up some sample data and code with creates such "issues".
Just as a side note: You can also calculate your log() directly as part of the SQL as done below.
data have;
infile datalines truncover;
input (sex age area n pop period) (:8.);
datalines;
1 1 3 20 20 1995
1 1 2 5 275 1995
1 1 1 10 300 1995
1 2 3 8 310 1995
1 2 2 26 280 1995
;
run;
proc sql;
create table want as
select area, period, sum(n) as nsum, sum(pop) as popsum, log(sum(pop)) as logpop
from have
group by area, period
;
quit;

- Mark as New
- Bookmark
- Subscribe
- Mute
- RSS Feed
- Permalink
- Report Inappropriate Content
Try:
proc summary data=your_data nway;
class area period ;
var n pop;
output out=mysums sum= nsum popsum;
run;
proc print data=work.mysums;
run;
Unless you need "by statements" you do not need to sort the input to proc summary;
If you add age and sex to the class statement and drop the nway option from the proc statement you will get all possible classifications of your class variables;
You can then use the value of _type_ in the output data set to select which classification scheme you want to explore for further analysis;
(I believe that you have a typo in lines 1 & 2 of the code your are presenting.)
.jpg")
Catch up on SAS Innovate 2026
Nearly 200 sessions are now available on demand in the Innovate Hub.
Watch Now →Learn the difference between classical and Bayesian statistical approaches and see a few PROC examples to perform Bayesian analysis in this video.

Find more tutorials on the SAS Users YouTube channel.
SAS Training: Just a Click Away
Ready to level-up your skills? Choose your own adventure.
-
5 replies
-
01-03-2015 05:31 PM
-
3403 views
-
6 likes
-
4 in conversation
-
