- Home
- /
- Programming
- /
- SAS Procedures
- /
- Re: Sensitivity,Specificity and Youden index
- RSS Feed
- Mark Topic as New
- Mark Topic as Read
- Float this Topic for Current User
- Bookmark
- Subscribe
- Mute
- Printer Friendly Page

- Mark as New
- Bookmark
- Subscribe
- Mute
- RSS Feed
- Permalink
- Report Inappropriate Content
How to calculate the sensitivity,specificity and Youden index for 18 factors,and its combination (6 factors in each) with an outcome measure.
Accepted Solutions

- Mark as New
- Bookmark
- Subscribe
- Mute
- RSS Feed
- Permalink
- Report Inappropriate Content
Read this SAS support note: 24170 - Estimating sensitivity, specificity, positive and negative predictive values, and other stat...
Run that code first, this code can inform you about obtaining sensitivity and specificity as values.
PROC TABULATE
DATA=WORK.FATCOMP
OUT =WORK.STABSummaryTablesFATCOMP(LABEL="Summary Tables for WORK.FATCOMP");
CLASS Test / ORDER=UNFORMATTED DESCENDING MISSING;
CLASS Response / ORDER=UNFORMATTED DESCENDING MISSING;
TABLE Test*ColPctN,Response;
FREQ Count;
RUN;
data numbers (Keep=sensitivity specificity);
do until (eof);
set &syslast end=eof;
if Test=1 and Response=1 then sensitivity=PctN_01;
if Test=0 and Response=0 then specificity=PctN_01;
end;
putlog "NOTE: " sensitivity= specificity=;
output;
stop;
run;
- Mark as New
- Bookmark
- Subscribe
- Mute
- RSS Feed
- Permalink
- Report Inappropriate Content
PROC MEANS/SUMMARY can be used to calculate a confusion matrix.
- Mark as New
- Bookmark
- Subscribe
- Mute
- RSS Feed
- Permalink
- Report Inappropriate Content
We can communicate a solution more effectively if you give us a sample of your data. Then we can speak in terms of your data's variables names.
- Mark as New
- Bookmark
- Subscribe
- Mute
- RSS Feed
- Permalink
- Report Inappropriate Content
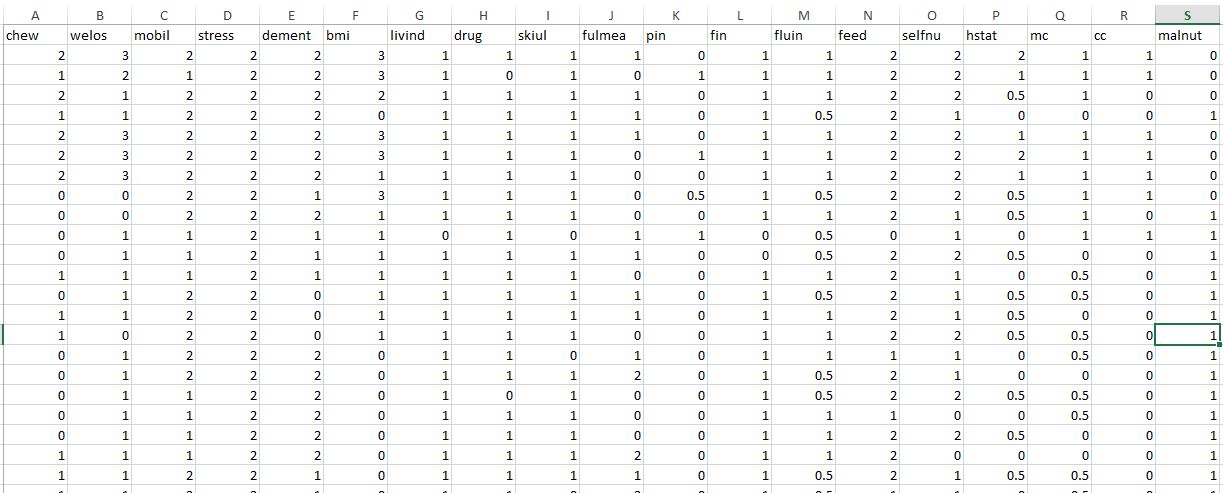
Thank you for your kind reply.I have added sample of my data.Here 'malnut'(malnutrition) is the outcome measure and others like chew,weilos......cc are the independent variables.I want to get the sensitivity,specificity and youden index of each of these variables and their combination having 6 factors(A+B+C+D+E+F) like 'chew,weilos,mobil,stress,dement,bmi' with the outcome measure.
- Mark as New
- Bookmark
- Subscribe
- Mute
- RSS Feed
- Permalink
- Report Inappropriate Content
So you want sensitivity and specificity with respect to what predictive model? Is 'MALNUT' the result of your predictive model, or is it the known state of the patient? If you have established a predictive model then its outcome would be compared with the clinical data, this is how I know this type of statistics. I can refer you to https://en.wikipedia.org/wiki/Confusion_matrix. I don't know anything in SAS_STATS that will do this, but perhaps this question should be posed in that forum: https://communities.sas.com/community/support-communities/sas_statistical_procedures .
- Mark as New
- Bookmark
- Subscribe
- Mute
- RSS Feed
- Permalink
- Report Inappropriate Content
Thank you for your consistent support. Ya 'Malnut' is the known state of the patient,which indicates malnutrition.Here we wish to find the sensitivity and specificity of each factor and 'Malnut' status 0=not malnourished & 1=malnourished.Thanks for your directions.

- Mark as New
- Bookmark
- Subscribe
- Mute
- RSS Feed
- Permalink
- Report Inappropriate Content
Run a proc freq between each set of variables. That will create your cross tabs and you can get the number from there to calculate your specificity/sensitivity.
- Mark as New
- Bookmark
- Subscribe
- Mute
- RSS Feed
- Permalink
- Report Inappropriate Content
Definitely i will do so :smileycool:
- Mark as New
- Bookmark
- Subscribe
- Mute
- RSS Feed
- Permalink
- Report Inappropriate Content
Actually PROC MEANS is what I've used and it involved another step, but PROC TABULATE can be used using one step.
My question about predictive models is still relevant: I believe you need to choose dichotomous values to represent your independent variables to do this correctly. If both MALNUT and another variable, _x_ are dichotomous then this code will produce a dataset with up to four rows, each corresponding to a cell of the confusion matrix. Sensitivity, specificity and Youden's index can be calculated from these values.
PROC TABULATE DATA=Given_DS
OUT=Want_X_vs_Malnut ;
CLASS _x_ ;
CLASS Malnut ;
TABLE _x_,Malnut * N ;
;
RUN;
- Mark as New
- Bookmark
- Subscribe
- Mute
- RSS Feed
- Permalink
- Report Inappropriate Content
Thank you very much, Phil for your extremely valuable SAS codes.In my data set i have coded the independent and dependent variable(s) as dichotomous ones; 0=no & 1=yes.I have 190 rows of 18 independent dichotomous variables and 1 dependent dichotomous variable.
- Mark as New
- Bookmark
- Subscribe
- Mute
- RSS Feed
- Permalink
- Report Inappropriate Content
If you have your answer please mark the question answered ![]()
- Mark as New
- Bookmark
- Subscribe
- Mute
- RSS Feed
- Permalink
- Report Inappropriate Content
Well we technically did not answer the question pertaining to the combinations of factors... so... what can we do?
- Mark as New
- Bookmark
- Subscribe
- Mute
- RSS Feed
- Permalink
- Report Inappropriate Content
Thank you for the support offered !.I just wanted to get sensitivity and specificity.proc freq procedure produces that but its mixed with other values,is there any way to cull out only those 2 items from that table.
- Mark as New
- Bookmark
- Subscribe
- Mute
- RSS Feed
- Permalink
- Report Inappropriate Content
Read this SAS support note: 24170 - Estimating sensitivity, specificity, positive and negative predictive values, and other stat...
Run that code first, this code can inform you about obtaining sensitivity and specificity as values.
PROC TABULATE
DATA=WORK.FATCOMP
OUT =WORK.STABSummaryTablesFATCOMP(LABEL="Summary Tables for WORK.FATCOMP");
CLASS Test / ORDER=UNFORMATTED DESCENDING MISSING;
CLASS Response / ORDER=UNFORMATTED DESCENDING MISSING;
TABLE Test*ColPctN,Response;
FREQ Count;
RUN;
data numbers (Keep=sensitivity specificity);
do until (eof);
set &syslast end=eof;
if Test=1 and Response=1 then sensitivity=PctN_01;
if Test=0 and Response=0 then specificity=PctN_01;
end;
putlog "NOTE: " sensitivity= specificity=;
output;
stop;
run;
- Mark as New
- Bookmark
- Subscribe
- Mute
- RSS Feed
- Permalink
- Report Inappropriate Content
Thank you for SAS codes,Is there any provision(code) to find the Youden Index(sensitivity+specificity-1).
.jpg")
Catch up on SAS Innovate 2026
Nearly 200 sessions are now available on demand in the Innovate Hub.
Watch Now →Learn the difference between classical and Bayesian statistical approaches and see a few PROC examples to perform Bayesian analysis in this video.

Find more tutorials on the SAS Users YouTube channel.
SAS Training: Just a Click Away
Ready to level-up your skills? Choose your own adventure.
-
17 replies
-
07-22-2015 09:31 AM
-
10892 views
-
9 likes
-
3 in conversation
-
