- Home
- /
- Programming
- /
- SAS Procedures
- /
- Query for dummy coding with females as a reference group.
- RSS Feed
- Mark Topic as New
- Mark Topic as Read
- Float this Topic for Current User
- Bookmark
- Subscribe
- Mute
- Printer Friendly Page

- Mark as New
- Bookmark
- Subscribe
- Mute
- RSS Feed
- Permalink
- Report Inappropriate Content
Hello all, please help this question or any link for similar examples.
Q. A researcher is interested in predicting self-esteem(RESE) among University students. He believes that self-esteem can be predicted based on overall stress and happiness levels as well as gender. Using an appropriate PROC procedure and dummy coding with females(1) as a reference group, run a following model using SAS:
RSESi=b0 + b1*Genderi + b2*Stress_i + b3*Happiness_i + b4*Gender_i*Happinessi + e_i
| ID | bfie | bfia | bfic | bfin | bfio | RSES | gender | happiness | stress | airscomp | autproc | autrelor | IDF | burnout | relqual | autaware |
| 1 | 3.625 | 3.11111 | 3.55556 | 3.125 | 4.1 | 2.9 | 1 | 3.50333 | 3.27273 | 6.68269 | 2.9 | 3.16667 | 2.875 | 3.50333 | 9.4286 | 3 |
| 2 | 3.5 | 4.11111 | 3.88889 | 3.5 | 3.9 | 4 | 2 | 3.78 | 1 | 9 | 4.5 | 4.08333 | 3 | 3.78 | 15.3333 | 3.83333 |
Thanks in advance.

- Mark as New
- Bookmark
- Subscribe
- Mute
- RSS Feed
- Permalink
- Report Inappropriate Content
This is clearly a homework type question. Why not try researching it first, running some code and then post a question on here if the code doesn't work?

- Mark as New
- Bookmark
- Subscribe
- Mute
- RSS Feed
- Permalink
- Report Inappropriate Content
Newmkka,
To follow-up on Keith's comments, a good place to start your research would be with a couple of Google searchs:
dummy coding reference group
dummy coding reference group site:sas.com
Doc Muhlbaier
Duke
- Mark as New
- Bookmark
- Subscribe
- Mute
- RSS Feed
- Permalink
- Report Inappropriate Content
Hello, I made a dummy variable and run a model in SAS:
data dummy;
set work.Datafile;
d1 = 0 ;
if gender = "1" then d1 = 1 ; <------- here is right? females(1) reference?
run;
data dummy;
set work.dummy;
Gender_Happiness = gender*happiness;
run;
proc reg data = work.dummy;
model rses = gender stress happiness Gender_Happiness;
run;
Something wrong can you see? Please collect it. Thanks in advance.

- Mark as New
- Bookmark
- Subscribe
- Mute
- RSS Feed
- Permalink
- Report Inappropriate Content
- Mark as New
- Bookmark
- Subscribe
- Mute
- RSS Feed
- Permalink
- Report Inappropriate Content
Thanks your help. Even though I read it, I don't know which part should I modify. Can you help me?
Thanks

- Mark as New
- Bookmark
- Subscribe
- Mute
- RSS Feed
- Permalink
- Report Inappropriate Content
What about:
proc glm data=work.datafile;
class gender(ref=first);
model rses=stress happiness gender gender*happiness/solution;
quit;
PROC GLM is designed for exactly this kind of regression, and the use of the ref= option in the class statement makes it easy to set females as the reference class.
Steve Denham
- Mark as New
- Bookmark
- Subscribe
- Mute
- RSS Feed
- Permalink
- Report Inappropriate Content
Thanks for your code. But it has syntax error ("ref=") this. gender value are both 1 and 2. and want females as a reference group. So I use (ref=1). But it doesn't work. Can you help me more?
- Mark as New
- Bookmark
- Subscribe
- Mute
- RSS Feed
- Permalink
- Report Inappropriate Content
What do you mean by "it doesn't work"? Could you please share your results? If females are coded in gender as 1, they are first in the category, and so there should be no problem. It may be just a problem in interpreting the output.
Steve Denham
- Mark as New
- Bookmark
- Subscribe
- Mute
- RSS Feed
- Permalink
- Report Inappropriate Content
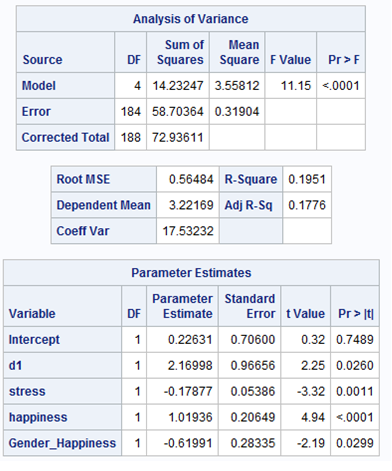
Finally I got the results. Can you help to interpret these questions? If wrong, collect it please.
1. Is the overall model significant? Report your finding using APA format.
The overall model is significant, F(11.15) , p = <.0001
2. Determine which coefficients are statistically significant. Report your findings using APA format.
Happiness is significant (p<.0001), stress is also significant, (p=0.0011), gender*happiness is also significant (p=0.0299). Also dummy code is significant (p=0.026
3. What is an average level of self-esteem for males?
An average level of self-esteem is 2.39629. (actually I run it again with male as a reference) How to get it without running code again?
4. What is the estimated effect of happiness and what does it mean?
Happiness Coefficient – For Female (reference group), one unit increase in a number of happiness results in increasing self-esteem by 1.0193
5. What is the estimated effect of stress and what does it mean?
Stress Coefficient – One unit increase in a number of happiness results in increasing self-esteem by -0.17877
6. What is the estimated effect of gender and happiness and what does it mean?
Interaction Term (Gender and happiness) - One unit increase in a number of happiness results in increasing self-esteem by -0.61991.
Interaction Term (Gender and happiness) – Since that is an additive effect we could calculate a (1.01936 + (-0.61991) = 0.39945). One unit increase in a number of happiness results in increasing self-esteem by 0.39945.
(which one is correct?)
7. What is the estimated main effect of gender and what does it mean?
Male have 2.16998 higher values compared to female.
8. Based on an appropriate statistic determine a model fit. Report your findings.
Based on an R-Square value, the IVs predict an amount 20 percent DV.
- Mark as New
- Bookmark
- Subscribe
- Mute
- RSS Feed
- Permalink
- Report Inappropriate Content
This has obviously developed into a homework/take home exam question. Interpretation is left to the analyst.
Steve Denham
.jpg")
Catch up on SAS Innovate 2026
Nearly 200 sessions are now available on demand with the SAS Innovate Digital Pass.
Explore Now →Learn the difference between classical and Bayesian statistical approaches and see a few PROC examples to perform Bayesian analysis in this video.

Find more tutorials on the SAS Users YouTube channel.
SAS Training: Just a Click Away
Ready to level-up your skills? Choose your own adventure.
-
10 replies
-
11-19-2012 12:01 AM
-
4762 views
-
0 likes
-
5 in conversation
-
