- Home
- /
- Programming
- /
- SAS Procedures
- /
- Proc Gplot: Axis values
- RSS Feed
- Mark Topic as New
- Mark Topic as Read
- Float this Topic for Current User
- Bookmark
- Subscribe
- Mute
- Printer Friendly Page

- Mark as New
- Bookmark
- Subscribe
- Mute
- RSS Feed
- Permalink
- Report Inappropriate Content
Hello!
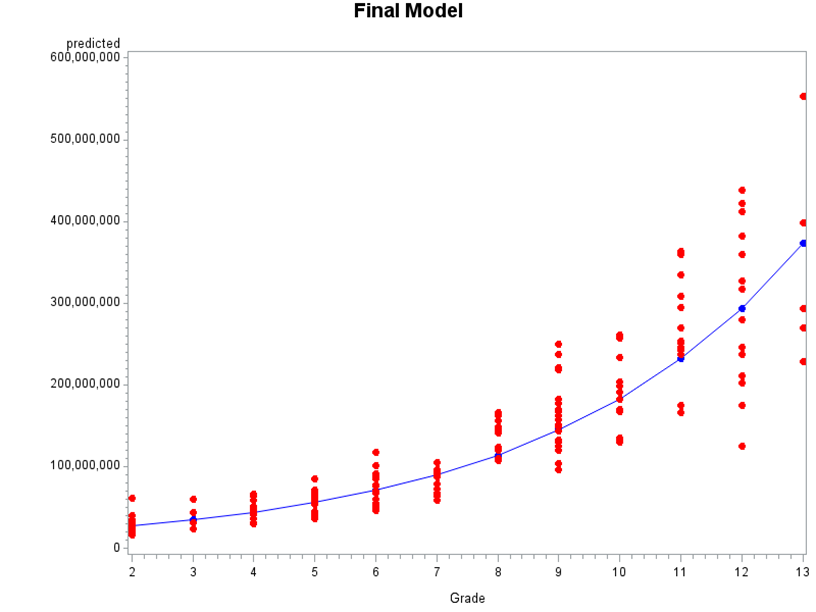
Does anybody know how to change the axes values? I am plotting a series of scatterplots and when the numbers get too big sometimes they appear in scientific notation. How can I change that?
Unwanted Y-axis:

Desired Y-Axis
Accepted Solutions

- Mark as New
- Bookmark
- Subscribe
- Mute
- RSS Feed
- Permalink
- Report Inappropriate Content
Hi,
Without any sample data/code, I created something...
DATA HAVE;
DO I = 5000000 TO 25000000 BY 5000000;
REVENUE = I;
PROFIT = I/20;
OUTPUT;
END;
DROP I;
RUN;
PROC FORMAT;
VALUE BIG 5000000 = "5,000,000"
10000000 = "10,000,000"
15000000 = "15,000,000"
20000000 = "20,000,000"
25000000 = "25,000,000"
;
QUIT;
GOPTIONS RESET = ALL;
AXIS1 LABEL = (F = ARIAL H = 2 A = 90 "REVENUE" )
ORDER = (5000000 TO 25000000 BY 5000000) V = (F = ARIAL H = 1.5);
PROC GPLOT DATA = HAVE;
PLOT REVENUE * PROFIT/VAXIS = AXIS1;
FORMAT REVENUE BIG.;
RUN;QUIT;
Bascially, I think you may need to use some format.
Good luck!
Anca.

- Mark as New
- Bookmark
- Subscribe
- Mute
- RSS Feed
- Permalink
- Report Inappropriate Content
I'm guessing the the likely current format for your predicted variable is BEST8. You don't need a custom format COMMA12. should work for your displayed example.
If you aren't interested in the level of control an AXIS statement gives add statements similar to:
Format minsalary comma12.;
label minsalary = 'Predicted';
to the proc statements.
- Mark as New
- Bookmark
- Subscribe
- Mute
- RSS Feed
- Permalink
- Report Inappropriate Content
Formatting worked! ![]()
Thank you all very much!
.jpg")
Catch up on SAS Innovate 2026
Nearly 200 sessions are now available on demand in the Innovate Hub.
Watch Now →Learn the difference between classical and Bayesian statistical approaches and see a few PROC examples to perform Bayesian analysis in this video.

Find more tutorials on the SAS Users YouTube channel.
SAS Training: Just a Click Away
Ready to level-up your skills? Choose your own adventure.
-
3 replies
-
08-05-2013 11:13 AM
-
5666 views
-
4 likes
-
3 in conversation
-
