- Home
- /
- Programming
- /
- SAS Procedures
- /
- MEANING? Convergence criterion (GCONV=1E-8) satisfied
- RSS Feed
- Mark Topic as New
- Mark Topic as Read
- Float this Topic for Current User
- Bookmark
- Subscribe
- Mute
- Printer Friendly Page

- Mark as New
- Bookmark
- Subscribe
- Mute
- RSS Feed
- Permalink
- Report Inappropriate Content
I am using some logistic regression testing and I have received this message.
Not quite sure what this means...
My coefficients are pleasingly significant. I performed an AUTO CORR command to see whether autocorrelation could corrupt my results however the results are good. So is this message "Convergence criterion (GCONV=1E-8) satisfied" normal?

- Mark as New
- Bookmark
- Subscribe
- Mute
- RSS Feed
- Permalink
- Report Inappropriate Content
- Mark as New
- Bookmark
- Subscribe
- Mute
- RSS Feed
- Permalink
- Report Inappropriate Content
Thanks very much. Could you please help me solve below? I have ensured my dependent variable is either 1 or 0 and my independents are different.
I received this message when performing some of my testing: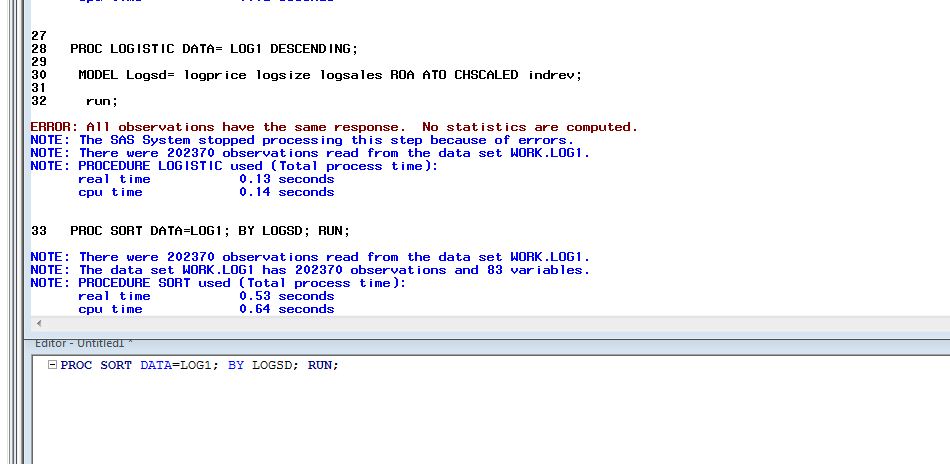
- Mark as New
- Bookmark
- Subscribe
- Mute
- RSS Feed
- Permalink
- Report Inappropriate Content
The screen image is very fuzzy, I can't read everything. The error says that among the observations where all variables are not missing (only those are considered) the dependent variable always has the same value. This could be caused by all the logs involved, if missing values were generated when calculating them, in a previous step.
PG
- Mark as New
- Bookmark
- Subscribe
- Mute
- RSS Feed
- Permalink
- Report Inappropriate Content
I have received a warning message saying "ridging has failed to improve the log likelihood" and the validity of the fit is questionable.
I have four different dummy variables in this regression, the dependent, and three control independents. Do you think this could cause the error?
I have checked for duplicates, blanks in the dummies, and auto correlation, all seem to be OK

- Mark as New
- Bookmark
- Subscribe
- Mute
- RSS Feed
- Permalink
- Report Inappropriate Content
I would start by looking at the table produced by
proc freq data=yourData;
tables logsd*yourdum1*yourdum2*yourdum3*yourdum4 / list nocum nopercent;
run;
and check for combinations that are not well represented in your data.
PG

- Mark as New
- Bookmark
- Subscribe
- Mute
- RSS Feed
- Permalink
- Report Inappropriate Content
Hi,
I was searching for the meaining of GCONV=1E-8 which led me to this post. However I am not able to see your reply. I have attached the screenshot for your reference. Thanks in advance for your help.
Thanks,
Ved


- Mark as New
- Bookmark
- Subscribe
- Mute
- RSS Feed
- Permalink
- Report Inappropriate Content
This note means that the relative gradient (max of the first derivatives wrt to the fixed effect parameters)/ absolute value of the objective function has reached a near zero value (0.00000001), thus you are at a maximum/minimum/saddle point of the objective function. Changing parameter values won't improve the fit to the data.
Steve Denham
.jpg")
Catch up on SAS Innovate 2026
Nearly 200 sessions are now available on demand with the SAS Innovate Digital Pass.
Explore Now →Learn the difference between classical and Bayesian statistical approaches and see a few PROC examples to perform Bayesian analysis in this video.

Find more tutorials on the SAS Users YouTube channel.
SAS Training: Just a Click Away
Ready to level-up your skills? Choose your own adventure.
-
7 replies
-
07-15-2012 06:47 AM
-
10303 views
-
0 likes
-
4 in conversation
-
