- Home
- /
- Programming
- /
- SAS Procedures
- /
- Re: Logarithmic Scale?
- RSS Feed
- Mark Topic as New
- Mark Topic as Read
- Float this Topic for Current User
- Bookmark
- Subscribe
- Mute
- Printer Friendly Page

- Mark as New
- Bookmark
- Subscribe
- Mute
- RSS Feed
- Permalink
- Report Inappropriate Content
I have the following data below and know that the values were found by using a logarithmic scale. How do I incorporate that into my t-test? Would I have to use a log statement somewhere? If so, where? If not, why not?
Thank you
data work.compare;
length group $1;
input group value;
cards;
A 2.7
A 0.0
A 3.1
A 4.6
B 6.2
B 5.2
B 3.5
B 3.6
B 5.9
;
run;
ods graphics on;
proc ttest data=work.compare plots=box;
class group;
var value;
ods graphics off;

- Mark as New
- Bookmark
- Subscribe
- Mute
- RSS Feed
- Permalink
- Report Inappropriate Content
Hi,
For some data, it is reasonable to assume that the logarithm are normally distributed. Taking the logarithms often stabilizes the group variances. Compare group variances on the original scale (assumed logarithmic) and the back transformed scale (assumed linear):
data compare;
length group $1;
input group Value;
expValue = exp(value);
label Value="Log Value" expValue = "Linear Value";
cards;
A 2.7
A 0.0
A 3.1
A 4.6
B 6.2
B 5.2
B 3.5
B 3.6
B 5.9
;
ods listing exclude ConfLimits;
proc ttest data=compare plots=none;
class group;
var value expValue;
run;
The TTEST Procedure
Variable: Value (Log Value)
group N Mean Std Dev Std Err Minimum Maximum
A 4 2.6000 1.9166 0.9583 0 4.6000
B 5 4.8800 1.2677 0.5669 3.5000 6.2000
Diff (1-2) -2.2800 1.5788 1.0591
Method Variances DF t Value Pr > |t|
Pooled Equal 7 -2.15 0.0683
Satterthwaite Unequal 5.0074 -2.05 0.0958
Equality of Variances
Method Num DF Den DF F Value Pr > F
Folded F 3 4 2.29 0.4414
Variable: expValue (Linear Value)
group N Mean Std Dev Std Err Minimum Maximum
A 4 34.3905 44.2774 22.1387 1.0000 99.4843
B 5 221.8 203.4 90.9600 33.1155 492.7
Diff (1-2) -187.4 156.5 105.0
Method Variances DF t Value Pr > |t|
Pooled Equal 7 -1.79 0.1174
Satterthwaite Unequal 4.467 -2.00 0.1085
Equality of Variances
Method Num DF Den DF F Value Pr > F
Folded F 4 3 21.10 0.0311
Variances are indeed more stable on the (assumed) log scale. It is thus better justified to run parametric tests (such as the t-test) on that scale. No special option required.
PG

- Mark as New
- Bookmark
- Subscribe
- Mute
- RSS Feed
- Permalink
- Report Inappropriate Content
Not sure why logarithmic scale was used? Log transformation is usually done on skewed data. With this small sample size it would be hard to validate results statistically. Also t test interpertation based on log data will not be the same as on original data.

- Mark as New
- Bookmark
- Subscribe
- Mute
- RSS Feed
- Permalink
- Report Inappropriate Content
stat@sas: Although the log transform is used empirically on skewed data (the variance stabilization that PGStats mentioned), in some areas it is the standard approach to work with certain types of variables. It may be that the data are known from other work to follow a lognormal distribution.
Bailey: If the data are indeed log scaled, stat@sas' comment on interpretation needs to be paid attention to. The test statistics are valid and the means/S.D's are too (on the log scale). Where you run into challenges is that the difference of the means may not be interpretable.
- Mark as New
- Bookmark
- Subscribe
- Mute
- RSS Feed
- Permalink
- Report Inappropriate Content
Agreed - I was concerned about the interpretation of results based on original vs log transformed data.

- Mark as New
- Bookmark
- Subscribe
- Mute
- RSS Feed
- Permalink
- Report Inappropriate Content
Exponentiate the results for interpretation...
- Mark as New
- Bookmark
- Subscribe
- Mute
- RSS Feed
- Permalink
- Report Inappropriate Content
What do you mean by "Exponentiate the results for interpretation" please?
- Mark as New
- Bookmark
- Subscribe
- Mute
- RSS Feed
- Permalink
- Report Inappropriate Content
slg, that's the problem: If you take a mean of logged data (as Bailey did in the t-test) and exponentiate that mean, it is NOT an estimate of the mean of the non-logged data.You end up with the geometric mean, which is much more difficult to interpret.
- Mark as New
- Bookmark
- Subscribe
- Mute
- RSS Feed
- Permalink
- Report Inappropriate Content
I don't believe I stated that exponentiation produces the mean of the non-logged data. Assuming that the log-transformation is warranted due to extreme skew or outliers then the mean of the non-logged data will not give useful information (i.e., is not a typical value of the distribution). Log transformation "normalizes" the distribution - but the log-mean is not a meaningful value (in terms of the original unit of measurement of the data), hence makes sense to take the anti-log to bring the mean value back to the original unit of measurement. The new value (which as you correctly point out is the geometric mean) is a "normalized mean" and is, of course, different from the original mean... but assuming that the outliers in the original distribution are results of anomaly, it is a better representation of the central location. Why is that difficult?
- Mark as New
- Bookmark
- Subscribe
- Mute
- RSS Feed
- Permalink
- Report Inappropriate Content
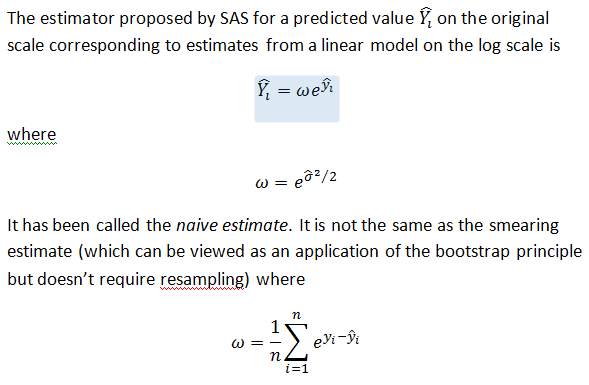
In some fields, such as solution chemistry, it is quite natural to take the logarithms of measurements (e.g. concentrations) and build linear models about them. But at one point, predictions must be back-transformed to their original scale and true means are required. Many estimators of the true mean have been proposed for the back-transformation problem. My favorite is Duan's Smearing Estimator which is fairly simple and robust.
Log transformation is however not a good method for dealing with the skewing effect of outliers. You will be much better off with more robust location estimators such as the median or the Winsorized mean and scale estimators such as MAD, Qn or Sn.
PG

- Mark as New
- Bookmark
- Subscribe
- Mute
- RSS Feed
- Permalink
- Report Inappropriate Content
What looks like a smearing estimator is presented in the PROC GLIMMIX documentation where DIST=LOGNORMAL is discussed (although it is NOT the nonparametric bootstrapped value in the original paper). A big tip of the hat to you, PG, for giving me a name for what we have been doing, according to the stub definition on Wikipedia.
Steve Denham
- Mark as New
- Bookmark
- Subscribe
- Mute
- RSS Feed
- Permalink
- Report Inappropriate Content
- Mark as New
- Bookmark
- Subscribe
- Mute
- RSS Feed
- Permalink
- Report Inappropriate Content
Raise the log base by the result. For example in your data the first case (A) = 2.7. Assuming that 2.7 is a log to the base 10, exponentiation = 10^2.7 or 501.2. If it is a log to the base e, then 2.7183^2.7 = 14.88 etc... Hope this helps..
- Mark as New
- Bookmark
- Subscribe
- Mute
- RSS Feed
- Permalink
- Report Inappropriate Content
Thanks - What is the interpretation based on this statistic?
.jpg")
Catch up on SAS Innovate 2026
Nearly 200 sessions are now available on demand in the Innovate Hub.
Watch Now →Learn the difference between classical and Bayesian statistical approaches and see a few PROC examples to perform Bayesian analysis in this video.

Find more tutorials on the SAS Users YouTube channel.
SAS Training: Just a Click Away
Ready to level-up your skills? Choose your own adventure.
-
13 replies
-
08-22-2014 09:27 PM
-
10233 views
-
1 like
-
6 in conversation
-
