- Home
- /
- Programming
- /
- SAS Procedures
- /
- How to use proc tabulate to create table with multiple different rows?
- RSS Feed
- Mark Topic as New
- Mark Topic as Read
- Float this Topic for Current User
- Bookmark
- Subscribe
- Mute
- Printer Friendly Page

- Mark as New
- Bookmark
- Subscribe
- Mute
- RSS Feed
- Permalink
- Report Inappropriate Content
I have a table looks like this:
And I want to use Proc tabulate to create a tabular report like this:
What should be the correct way to do this?
Accepted Solutions

- Mark as New
- Bookmark
- Subscribe
- Mute
- RSS Feed
- Permalink
- Report Inappropriate Content
Hi:
I think your issue is defining too many of your variables as being a CLASS (category or grouping) usage, when it seems to me that GROUPX, RESPONDENT, CLASS_A, CLASS_B, and CLASS_C should all be ANALYSIS variables in a VAR statement, not a CLASS statement. Then your next issue is using the * (asterisk) operator, which nests or crosses items and instead, you want them to merely be "stacked" or concatenated -- for each variable (GROUPX, RESPONDENT, etc) to be a separate row in the report table.
Something more like the code below, that produced this output:
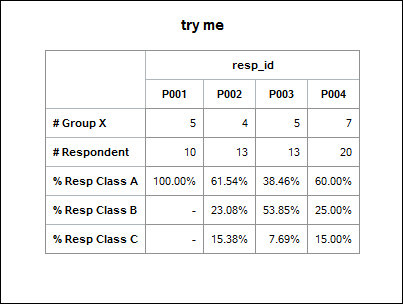
Cynthia
data my_data;
infile datalines dlm=',' dsd;
input resp_id $ groupx respondent class_A class_B class_C;
** adjust these 3 so that can use simple PERCENT format (which multiplies by 100);
class_A = class_A / 100;
class_B = class_B / 100;
class_C = class_C / 100;
return;
datalines;
P001,5,10,100,.,.
P002,4,13,61.53846,23.07692,15.38462
P003,5,13,38.46154,53.84615,7.692308
P004,7,20,60,25,15
;
run;
ods html file='c:\temp\diff_tabulate.html' style=pearl;
proc tabulate data=my_data f=comma6.0;
class resp_id/ missing style=Header{background=white};
var class_a class_b class_c respondent groupx / style=Header{background=white};
table groupx respondent class_a*f=percent9.2 class_b*f=percent9.2 class_c*f=percent9.2,
resp_id / row=float misstext='-';
title 'try me';
keylabel sum=' ';
label groupx = '# Group X'
respondent = '# Respondent'
class_a = '% Resp Class A'
class_b = '% Resp Class B'
class_c = '% Resp Class C';
run;
ods html close;
- Mark as New
- Bookmark
- Subscribe
- Mute
- RSS Feed
- Permalink
- Report Inappropriate Content
Hi:
I think your issue is defining too many of your variables as being a CLASS (category or grouping) usage, when it seems to me that GROUPX, RESPONDENT, CLASS_A, CLASS_B, and CLASS_C should all be ANALYSIS variables in a VAR statement, not a CLASS statement. Then your next issue is using the * (asterisk) operator, which nests or crosses items and instead, you want them to merely be "stacked" or concatenated -- for each variable (GROUPX, RESPONDENT, etc) to be a separate row in the report table.
Something more like the code below, that produced this output:
Cynthia
data my_data;
infile datalines dlm=',' dsd;
input resp_id $ groupx respondent class_A class_B class_C;
** adjust these 3 so that can use simple PERCENT format (which multiplies by 100);
class_A = class_A / 100;
class_B = class_B / 100;
class_C = class_C / 100;
return;
datalines;
P001,5,10,100,.,.
P002,4,13,61.53846,23.07692,15.38462
P003,5,13,38.46154,53.84615,7.692308
P004,7,20,60,25,15
;
run;
ods html file='c:\temp\diff_tabulate.html' style=pearl;
proc tabulate data=my_data f=comma6.0;
class resp_id/ missing style=Header{background=white};
var class_a class_b class_c respondent groupx / style=Header{background=white};
table groupx respondent class_a*f=percent9.2 class_b*f=percent9.2 class_c*f=percent9.2,
resp_id / row=float misstext='-';
title 'try me';
keylabel sum=' ';
label groupx = '# Group X'
respondent = '# Respondent'
class_a = '% Resp Class A'
class_b = '% Resp Class B'
class_c = '% Resp Class C';
run;
ods html close;
- Mark as New
- Bookmark
- Subscribe
- Mute
- RSS Feed
- Permalink
- Report Inappropriate Content
Thank you very much for you help!
.jpg")
Catch up on SAS Innovate 2026
Nearly 200 sessions are now available on demand with the SAS Innovate Digital Pass.
Explore Now →Learn the difference between classical and Bayesian statistical approaches and see a few PROC examples to perform Bayesian analysis in this video.

Find more tutorials on the SAS Users YouTube channel.
SAS Training: Just a Click Away
Ready to level-up your skills? Choose your own adventure.
-
2 replies
-
06-27-2015 07:14 AM
-
2086 views
-
0 likes
-
2 in conversation
-
