- Home
- /
- Programming
- /
- SAS Procedures
- /
- Re: How to use proc tabulate to create table with multiple different r...
- RSS Feed
- Mark Topic as New
- Mark Topic as Read
- Float this Topic for Current User
- Bookmark
- Subscribe
- Mute
- Printer Friendly Page
- Mark as New
- Bookmark
- Subscribe
- Mute
- RSS Feed
- Permalink
- Report Inappropriate Content
I have a table looks like this:
And I want to use Proc tabulate to create a tabular report like this:
What should be the correct way to do this?
Accepted Solutions
- Mark as New
- Bookmark
- Subscribe
- Mute
- RSS Feed
- Permalink
- Report Inappropriate Content
Hi:
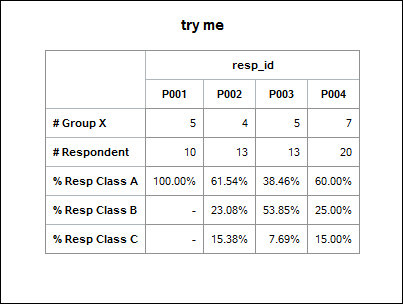
I think your issue is defining too many of your variables as being a CLASS (category or grouping) usage, when it seems to me that GROUPX, RESPONDENT, CLASS_A, CLASS_B, and CLASS_C should all be ANALYSIS variables in a VAR statement, not a CLASS statement. Then your next issue is using the * (asterisk) operator, which nests or crosses items and instead, you want them to merely be "stacked" or concatenated -- for each variable (GROUPX, RESPONDENT, etc) to be a separate row in the report table.
Something more like the code below, that produced this output:

Cynthia
data my_data;
infile datalines dlm=',' dsd;
input resp_id $ groupx respondent class_A class_B class_C;
** adjust these 3 so that can use simple PERCENT format (which multiplies by 100);
class_A = class_A / 100;
class_B = class_B / 100;
class_C = class_C / 100;
return;
datalines;
P001,5,10,100,.,.
P002,4,13,61.53846,23.07692,15.38462
P003,5,13,38.46154,53.84615,7.692308
P004,7,20,60,25,15
;
run;
ods html file='c:\temp\diff_tabulate.html' style=pearl;
proc tabulate data=my_data f=comma6.0;
class resp_id/ missing style=Header{background=white};
var class_a class_b class_c respondent groupx / style=Header{background=white};
table groupx respondent class_a*f=percent9.2 class_b*f=percent9.2 class_c*f=percent9.2,
resp_id / row=float misstext='-';
title 'try me';
keylabel sum=' ';
label groupx = '# Group X'
respondent = '# Respondent'
class_a = '% Resp Class A'
class_b = '% Resp Class B'
class_c = '% Resp Class C';
run;
ods html close;
- Mark as New
- Bookmark
- Subscribe
- Mute
- RSS Feed
- Permalink
- Report Inappropriate Content
Hi:
I think your issue is defining too many of your variables as being a CLASS (category or grouping) usage, when it seems to me that GROUPX, RESPONDENT, CLASS_A, CLASS_B, and CLASS_C should all be ANALYSIS variables in a VAR statement, not a CLASS statement. Then your next issue is using the * (asterisk) operator, which nests or crosses items and instead, you want them to merely be "stacked" or concatenated -- for each variable (GROUPX, RESPONDENT, etc) to be a separate row in the report table.
Something more like the code below, that produced this output:

Cynthia
data my_data;
infile datalines dlm=',' dsd;
input resp_id $ groupx respondent class_A class_B class_C;
** adjust these 3 so that can use simple PERCENT format (which multiplies by 100);
class_A = class_A / 100;
class_B = class_B / 100;
class_C = class_C / 100;
return;
datalines;
P001,5,10,100,.,.
P002,4,13,61.53846,23.07692,15.38462
P003,5,13,38.46154,53.84615,7.692308
P004,7,20,60,25,15
;
run;
ods html file='c:\temp\diff_tabulate.html' style=pearl;
proc tabulate data=my_data f=comma6.0;
class resp_id/ missing style=Header{background=white};
var class_a class_b class_c respondent groupx / style=Header{background=white};
table groupx respondent class_a*f=percent9.2 class_b*f=percent9.2 class_c*f=percent9.2,
resp_id / row=float misstext='-';
title 'try me';
keylabel sum=' ';
label groupx = '# Group X'
respondent = '# Respondent'
class_a = '% Resp Class A'
class_b = '% Resp Class B'
class_c = '% Resp Class C';
run;
ods html close;
- Mark as New
- Bookmark
- Subscribe
- Mute
- RSS Feed
- Permalink
- Report Inappropriate Content
Thank you very much for you help!
Learn the difference between classical and Bayesian statistical approaches and see a few PROC examples to perform Bayesian analysis in this video.
Find more tutorials on the SAS Users YouTube channel.
SAS Training: Just a Click Away
Ready to level-up your skills? Choose your own adventure.


