- Home
- /
- Programming
- /
- SAS Procedures
- /
- Re: How to count consecutive days with missing observations?
- RSS Feed
- Mark Topic as New
- Mark Topic as Read
- Float this Topic for Current User
- Bookmark
- Subscribe
- Mute
- Printer Friendly Page

- Mark as New
- Bookmark
- Subscribe
- Mute
- RSS Feed
- Permalink
- Report Inappropriate Content
This is an example of the data I have.
| ID | date | obs |
| 100 | 01Jan2014 | 45 |
| 100 | 02Jan2014 | 74 |
| 100 | 03Jan2014 | . |
| 100 | 04Jan2014 | . |
| 100 | 05Jan2014 | 20 |
| 100 | 06Jan2014 | 43 |
| 100 | 07Jan2014 | 23 |
| 100 | 08Jan2014 | . |
| 100 | 09Jan2014 | 456 |
| 100 | 10Jan2014 | 23 |
| 200 | 01Jan2014 | . |
| 200 | 02Jan2014 | . |
| 200 | 03Jan2014 | . |
| 200 | 04Jan2014 | . |
| 200 | 05Jan2014 | 42 |
| 200 | 06Jan2014 | 56 |
| 200 | 07Jan2014 | 32 |
| 200 | 08Jan2014 | . |
| 200 | 09Jan2014 | 32 |
| 200 | 10Jan2014 | . |
| 300 | 01Jan2014 | 556 |
| 300 | 02Jan2014 | . |
| 300 | 03Jan2014 | . |
| 300 | 04Jan2014 | . |
| 300 | 05Jan2014 | . |
| 300 | 06Jan2014 | . |
| 300 | 07Jan2014 | . |
| 300 | 08Jan2014 | 52 |
| 300 | 09Jan2014 | 12 |
| 300 | 10Jan2014 | 45 |
I want output that reports each occasion of missing values (coded as '.') for the variable obs. Each observation in the output dataset should represent an occasion when obs is missing for either a single day or consecutive days. Each observation in the new output needs to include the ID variable, a variable that identifies the occassion of missing data and the number of consecutive days that obs was missing. So the new count variable should equal 1 for single day of missing data or >1 for consecutive days of missing data.
Thank you in advance for any help you can offer on this problem.

- Mark as New
- Bookmark
- Subscribe
- Mute
- RSS Feed
- Permalink
- Report Inappropriate Content
Based on the data you mentioned. Give example of the output of data set you want.
- Mark as New
- Bookmark
- Subscribe
- Mute
- RSS Feed
- Permalink
- Report Inappropriate Content
I am looking for output like this:
| ID | first_date | count |
| 100 | 03Jan2014 | 2 |
| 100 | 08Jan2014 | 1 |
| 200 | 01Jan2014 | 4 |
| 200 | 08Jan2014 | 1 |
| 200 | 10Jan2014 | 1 |
| 300 | 02Jan2014 | 6 |
The first_date variable represents the date of missing data for a single day or the first day of consecutive days of missing data. Basically the output should let me estimate a mean length of consecutive days of missing values.

- Mark as New
- Bookmark
- Subscribe
- Mute
- RSS Feed
- Permalink
- Report Inappropriate Content
Assuming your data are sorted by id and date:
data want (where=(miscount>0));
set have;
by id date;
retain misscount;
if first.id then misscount= .;
if missing(obs) then misscount+1;
else misscount= .;
run;
Or if you want 0 instead of . for the missing count use 0.

- Mark as New
- Bookmark
- Subscribe
- Mute
- RSS Feed
- Permalink
- Report Inappropriate Content
infile cards dsd firstobs=2;
input ID :$3. date :date. obs;
format date date11.;
cards;
ID,date,obs
100,01Jan2014,45
100,02Jan2014,74
100,03Jan2014,.
100,04Jan2014,.
100,05Jan2014,20
100,06Jan2014,43
100,07Jan2014,23
100,08Jan2014,.
100,09Jan2014,456
100,10Jan2014,23
200,01Jan2014,.
200,02Jan2014,.
200,03Jan2014,.
200,04Jan2014,.
200,05Jan2014,42
200,06Jan2014,56
200,07Jan2014,32
200,08Jan2014,.
200,09Jan2014,32
200,10Jan2014,.
300,01Jan2014,556
300,02Jan2014,.
300,03Jan2014,.
300,04Jan2014,.
300,05Jan2014,.
300,06Jan2014,.
300,07Jan2014,.
300,08Jan2014,52
300,09Jan2014,12
300,10Jan2014,45
;;;;
run;
proc print;
run;
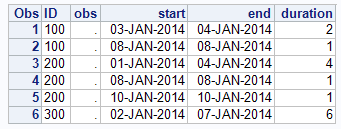
proc summary data=missdate nway;
by id obs notsorted;
output out=missreport(drop=_: where=(missing(obs))) min=start max=end n=duration;
run;
proc print;
run;
Message was edited by: data _null_ Added format statement format obs 1.;
- Mark as New
- Bookmark
- Subscribe
- Mute
- RSS Feed
- Permalink
- Report Inappropriate Content
This is what I needed. Thank you.

- Mark as New
- Bookmark
- Subscribe
- Mute
- RSS Feed
- Permalink
- Report Inappropriate Content
data missdate;
   infile cards dsd firstobs=2;
   input ID :$3. date :date. obs;
   format date date11.;
   cards;
ID,date,obs
100,01Jan2014,45
100,02Jan2014,74
100,03Jan2014,.
100,04Jan2014,.
100,05Jan2014,20
100,06Jan2014,43
100,07Jan2014,23
100,08Jan2014,.
100,09Jan2014,456
100,10Jan2014,23
200,01Jan2014,.
200,02Jan2014,.
200,03Jan2014,.
200,04Jan2014,.
200,05Jan2014,42
200,06Jan2014,56
200,07Jan2014,32
200,08Jan2014,.
200,09Jan2014,32
200,10Jan2014,.
300,01Jan2014,556
300,02Jan2014,.
300,03Jan2014,.
300,04Jan2014,.
300,05Jan2014,.
300,06Jan2014,.
300,07Jan2014,.
300,08Jan2014,52
300,09Jan2014,12
300,10Jan2014,45
;;;;
   run;
data want(drop=date);
 set missdate;
 by id obs notsorted;
 retain _date;
 if first.obs then do;_date=date;n=0; end;
 n+1;
 if last.obs and missing(obs) then output;
 format _date date9.;
 run;
Xia Keshan
.jpg")
Catch up on SAS Innovate 2026
Nearly 200 sessions are now available on demand with the SAS Innovate Digital Pass.
Explore Now →Learn the difference between classical and Bayesian statistical approaches and see a few PROC examples to perform Bayesian analysis in this video.

Find more tutorials on the SAS Users YouTube channel.
SAS Training: Just a Click Away
Ready to level-up your skills? Choose your own adventure.
-
6 replies
-
10-24-2014 03:37 PM
-
5913 views
-
0 likes
-
5 in conversation
-
